Amplitude Modulation
Note
This tutorial is applicable to UHF Series Instruments with the UHF-MF Multi-frequency and the UHF-MOD AM/FM Modulation options installed.
Goals and Requirements
This tutorial explains how to generate an amplitude modulated (AM) signal as well as how to demodulate an AM signal by reading out amplitude and phase of the carrier and the two sidebands simultaneously. The tutorial can be done using a simple loop back connection.
Preparation
To perform this tutorial, one simply needs to connect a BNC cable from Signal Output 1 to Signal Input 1 as shown in Figure 1. This will allow the user to perform the AM modulation and demodulation in this tutorial without needing an external source.

Connect the cables as described above. Make sure that the UHF unit is powered on and connected by USB to your host computer or by Ethernet to your local area network (LAN) where the host computer resides. After starting LabOne, the default web browser opens with the LabOne graphical user interface.
The tutorial can be started with the default instrument configuration (e.g. after a power cycle) and the default user interface settings (e.g. as is after pressing F5 in the browser).
Generate the Test Signal
In this section you will learn how to generate an AM signal with a 10.0 MHz, 1.0 Vpk sinusoidal carrier modulated by a 100 kHz, 200 mVpk sinusoid. The Lock-in tab and the MOD tab settings are shown in the following table.
| Tab | Sub-tab | Section | # | Label | Setting / Value / State |
|---|---|---|---|---|---|
| MOD | MOD 1 | Oscillators | 1 | Enable | ON |
| MOD | MOD 1 | Oscillators | 1 | Carrier | AM / 10.0 M |
| MOD | MOD 1 | Oscillators | 1 | Sideband 1 | 100.0 k |
| MOD | MOD 1 | Input | 1 | Signal | Sig In 1 |
| MOD | MOD 1 | Generation | 1 | Signal Output | 1 |
| MOD | MOD 1 | Generation | 1 | Carrier (V) | 1.0 / ON |
| MOD | MOD 1 | Generation | 1 | Modulation (V) | 200.0 m / ON |
| Lock-in | All | Signal Outputs | 1 | Range | 1.5 V |
| Lock-in | All | Signal Outputs | 1 | On | ON |
| Lock-in | All | Signal Outputs | 1 | 50 Ω | OFF |
| Lock-in | All | Data Transfer | 1- 3 | Enable | ON |
| Lock-in | All | Data Transfer | 4- 8 | Enable | OFF |
| Lock-in | All | Output Amplitudes | 4- 8 | Amp 1 | OFF |
| Lock-in | All | Signal Inputs | 1 | Range | 1.5 V |
| Lock-in | All | Signal Inputs | 1 | 50 Ω | OFF |
To quickly verify that the AM signal is generated correctly, we can check the spectrum of the AM signal on Signal Input 1 using the Scope tool with the following settings. The Scope basically displays the FFT spectrum of Signal Input 1. With a sampling rate of 56 MHz, it satisfies sufficiently the Nyquist rate to see the 10 MHz carrier. The 64000 points samples correspond to a shot length of about 1.1 ms. This is enough to capture the frequency spectrum at kHz resolution.
| Tab | Sub-tab | Section | # | Label | Setting / Value / State |
|---|---|---|---|---|---|
| Scope | Control | Horizontal | Mode | Freq Domain FFT | |
| Scope | Control | Horizontal | Sampling Rate | 28 MHz | |
| Scope | Control | Horizontal | Length (pts) | 64000 | |
| Scope | Run/Stop | ON |
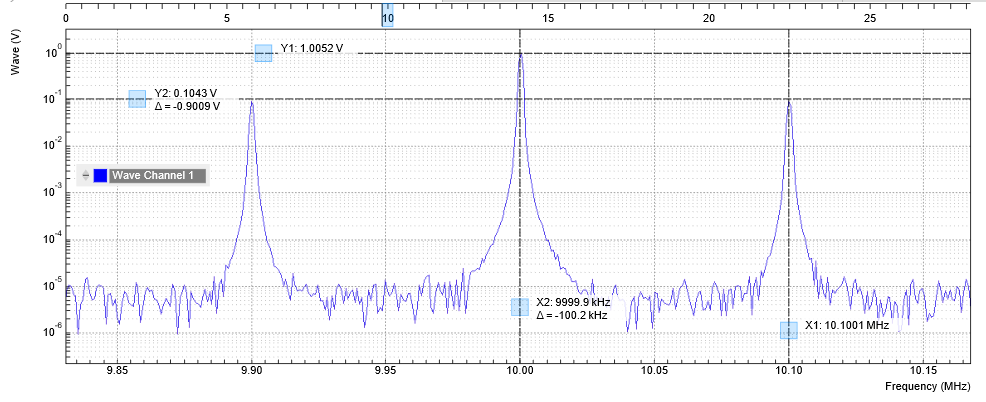
You should now observe a spectrum like the one shown in the screen capture below. All amplitudes are measured in peak values. The peak at the carrier frequency has an amplitude of about 1.0 V. The two sidebands have amplitudes of 100 mV, i.e. half of the Modulation amplitude 200 mV set in the MOD tab. The factor 0.5 is due to the fact that the original AM modulation signal power is shared between two sidebands. Note that, if we had not disabled the 50 Ω input impedance in the Lock-in tab, we would observe an additional factor 0.5 due to the voltage divider effect from the combination of the Signal Output impedance and the 50 Ω input impedance.
![]()
AM Demodulation Result
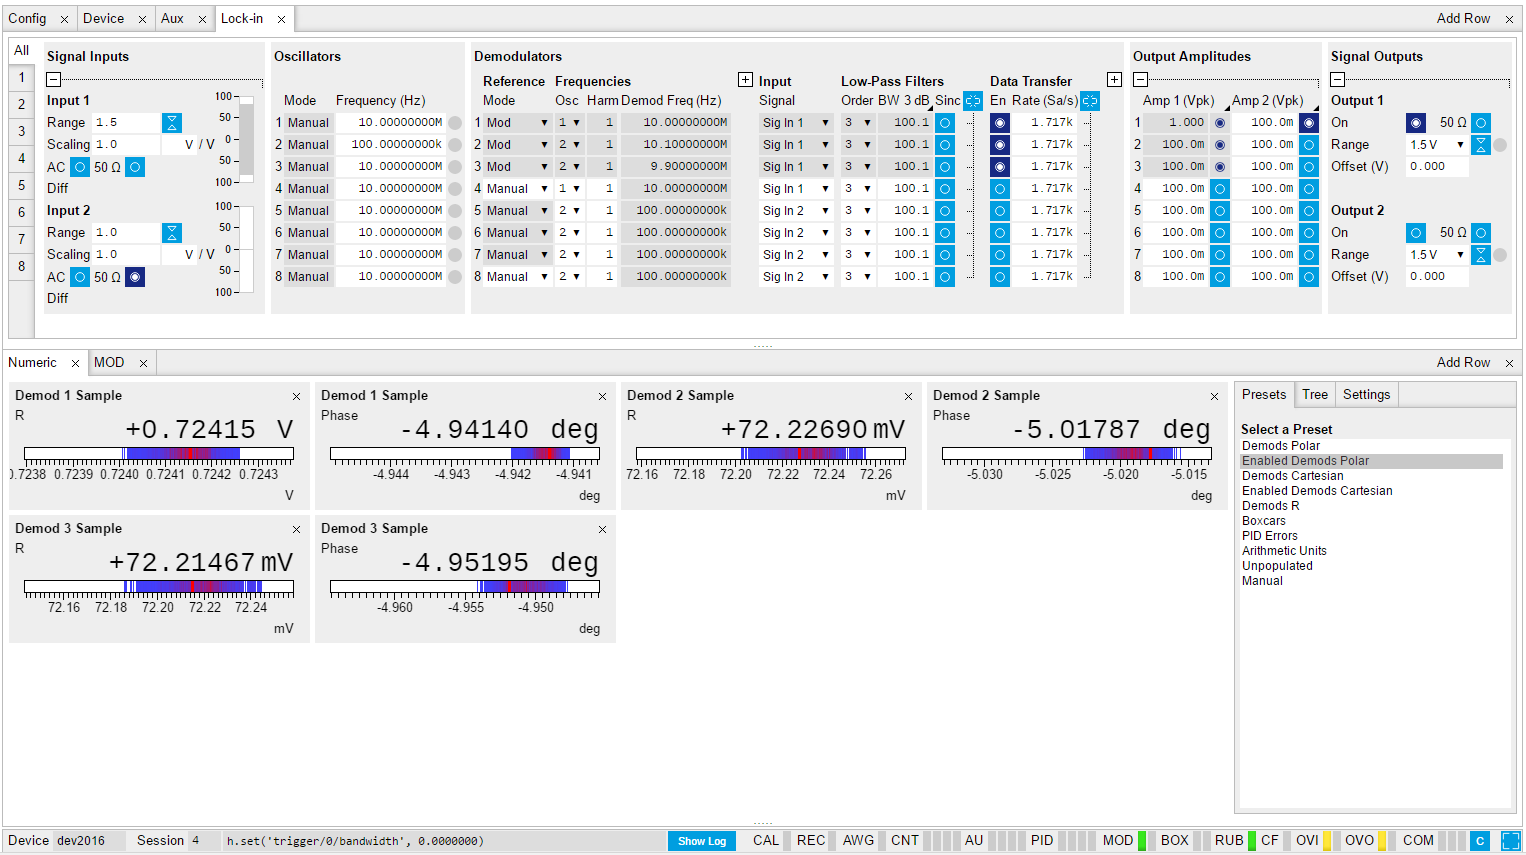
If you look at the Demod Freq column in the Lock-in tab, you will see demodulation frequencies of 10 MHz on demodulator 1, 10.1 MHz on demodulator 2 and 9.9 MHz on demodulator 3. You can now read out simultaneously the magnitude and the phase (R, Θ) or (X, Y) of the carrier component on demodulator 1, and the upper and lower sideband components on demodulator 2 and 3, respectively. The measurement result is available in the Numeric tab as shown in Figure 3
Note
By selecting "Enable Demod Polar" in the Numeric tab, only the enabled demodulator outputs will show.
If we take the sum of the double sideband’s amplitude (i.e. demodulator 2 and 3) and divide it by the amplitude of the carrier (demodulator 1), we will get an AM modulation index of h=Asidebands/Acarrier=0.2.