Boxcar Tab
The Boxcar tab relates to the UHF-BOX Boxcar Averager option and is only available if this option is installed on the UHF Instrument (see Information section in the Device tab).
Features
- 2 equivalent boxcar units with up to 450 MHz repetition rate
- Baseline suppression for each Boxcar unit
- up to 450 MHz repetition rate
- Dead time free operation for frequencies below 450 MHz
- Period waveform analyzer (PWA) allows display of waveform and convenient graphical setting of Boxcar averaging windows
- PWA frequency domain view allows for simultaneous analysis of up to 512 harmonics of the reference frequency
Description
The Boxcar tab provides access to the gated averaging functionality of the UHF Instrument. Whenever the tab is closed or an additional one of the same type is needed, clicking the following icon will open a new instance of the tab.
| Control/Tool | Option/Range | Description |
|---|---|---|
| Boxcar | Boxcar settings and periodic waveform analyzer for fast input signals. |
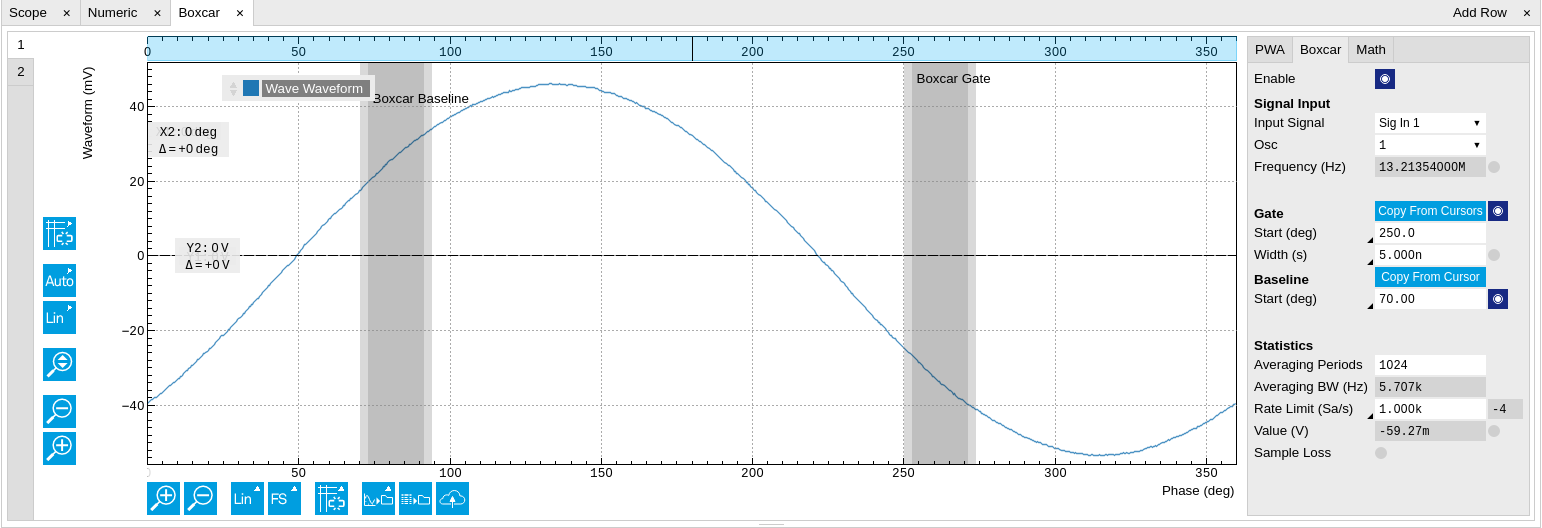
Each Boxcar unit is shown in a separate sub-tab (see Figure 1) that consists of a plot area and three control tabs on the right-hand side.
Similar to the lock-in amplifier functionality the Boxcar offers a large reduction of the incoming signal bandwidth sampled with 1.8 GSa/s to a regime where much lower sampling rates suffice that can easily be transferred to a PC over USB or Ethernet cable for further analysis and post processing. For both methods ideally no piece of signal information is lost during the data reduction but huge parts if the initial signal are discarded that contain no or a negligible piece of relevant information. The operation of the lock-in amplifier can most easily be understood considering the inputs signal in the frequency domain where the lock-in acts as a sophisticated bandpass filter with adjustable center frequency and bandwidth (if we generously ignore phase sensitivity here for the sake of simplicity). In contrast, the Boxcar does a very similar thing in the time domain where it allows to cut out only the signal components that contain information. A very common use case are experiments with pulsed lasers. In particular when duty cycles are low, the fraction of the time domain signal where there is actual information can be quite small and so the idea is to record only the parts when for instance the laser is on.
In classical analog instruments this is typically realized by a switch, that can by triggered externally, and a subsequent integrator. Most often the trigger functionality also allows to configure a time delay and a certain window for as long as the switch shall open up for each trigger and the signal will be integrated. The signal output from the integrator is then passed through an adjustable low-pass filter for further noise reduction.
One of the biggest limitations of analog boxcar instruments is their trigger re-arm time (caused by the finite time required to erase the integrator) which is usually several 10 ms long. During that time no signals can be acquired. For periodic signals this means a limitation to frequencies of a few 10 kHz when signal loss cannot be afforded, measurement time needs to be minimized while high SNR is crucial.
Note
The Zurich Instruments Boxcar uses a synchronous detection approach instead of the traditional triggering method described above. A reference frequency has to be provided - either from external or an internal oscillator can be used - instead of a trigger signal and the Boxcar window is defined in terms of the phases of that reference frequency.
Note
Using a synchronous detection scheme in combination with a fixed input sampling rate of 1.8 GSa/s excludes all commensurate signal frequencies from proper analysis. The UI provides warnings whenever the reference frequency is anywhere close to any of these. Potential issues can be easily quantified by displaying the bin counts in the PWA sub-tab.
Figure 2 shows a detailed block diagram how signal processing is performed.

The input signal is sampled at a rate of 1.8 GSa/s. Depending on the phase of the reference oscillator and the set Start Phase and Window Width each of these samples is added up and output from the Adder after each period. From there one branch is directly connected to the outPWA (see Out PWA Tab) for a further step of synchronous detection. The other signal path way is subject to a Moving Average filter that allows to average over an adjustable number of reference oscillator periods.
Note
The moving average filter provides up to 512 intermittent results. That means if Averaging Periods is set to 1024 the Output is updated with a new value every second oscillator period whereas for smaller numbers of averaging Periods this update is performed on every cycle.
Another big advantage of the Zurich Instruments Boxcar is the graphical display of the input signal termed Periodic Waveform Analyzer. Each Boxcar unit is equipped with a PWA unit that can be either bound to the Boxcar settings or used on any other signal input and oscillator independently. Figure 3 shows a block diagram of the PWA.

The user can select from a variety of different input signals, all of which will be re-sampled - either up or down, where no averaging is provided - at the input to a sampling rate of 450 MSa/s. Depending on the phase of the reference oscillator each data sample is associated to one of 1024 memory units which records the average values and the number of samples. These 1024 can be spread over the entire 360 degree of the reference oscillator period or a smaller span by using the Zoom mode. After an adjustable number of total input samples the entire memory is transferred to the PC and the memory is reset.
Each shot of data contains 1024 average values and sample counts each associated to a certain phase window. In case the reference frequency is sufficiently stable over the course of one shot it makes perfect sense to switch from the phase domain view to the time domain, which for some experiments might be the more natural way of consideration.
Functional Elements
| Control/Tool | Option/Range | Description |
|---|---|---|
| Run/Stop |  |
Continuously run and stop PWA acquisition. |
| Single |  |
Single acquisition of a PWA data set. |
| Input Signal | Signal Inputs, Trigger Inputs, Auxiliary Inputs, Auxiliary Outputs, Phase Demod 4, Phase Demod 8 | Select PWA input signal. |
| Input Interlock | ON / OFF | Interlock PWA and Boxcar Input settings |
| Osc | oscillator index | Select reference oscillator for PWA signal acquisition. |
| PWA Frequency | numeric value | Actual frequency at which the PWA operates based on set oscillator frequency and harmonic scaling factor. |
| Commensurability | grey/red | Traffic light showing whether the number of samples acquired is evenly distributed over all bins. |
| Mode | Harmonics (FFT) | Measurement data can be interpreted in four different modes and displayed over either phase (native), time, frequency (FFT) or harmonics of the base frequency (FFT). |
| Phase | ||
| Time | ||
| Freq Domain (FFT) | ||
| Copy from range |  |
Change PWA start and span according to plot range. |
| Reset |  |
Reset the start and width value to show the full 360 deg. |
| Start | numeric value | Defines the start of PWA range in time or phase. |
| Width | numeric value | Defines width of PWA range in time or phase. |
| Samples | 1 to 2^47 | Defines the number of samples acquired of each PWA data set (450 MSa/s). |
| Acq Time (s) | numeric value | Estimated time needed for recording of the specified number of samples. |
| Overflow | grey/red | Indicates whether the number of samples collected per bin or the amplitude exceeds the numerical limit. Reduce number of samples and/or change frequency. |
| Infinite Acq Time | string | The signal source of this unit (Boxcar) is not producing any data. Once it is configured and enabled, this field will indicate the duration of a single measurement. |
| Progress (%) | 0 to 100% | Show state of the PWA acquisition in percent. |
| 3dB Bandwidth | numeric value | 3dB bandwidth in Hz. |
| Max Harmonics | numeric value | Maximum number of displayed harmonics. |
| Signal | Count | Select signal to be displayed. |
| Waveform |
| Control/Tool | Option/Range | Description |
|---|---|---|
| Enable | ON / OFF | Enable the BOXCAR unit |
| Input Signal | 1/2 | Select Signal Input used for the boxcar analysis. |
| Osc | oscillator index | Selection of the oscillator used for the boxcar analysis. |
| Frequency (Hz) | frequency value | Oscillator frequency used for the boxcar analysis. |
| Too high frequency | grey/red | Frequency for the boxcar is above or equal 450 MHz. Sticky flag cleared by restarting the boxcar. The boxcar output may not be reliable any more. |
| Copy from cursors |  |
Take cursor values to define Window Start and Window span values. |
| Show Gate Opening | ON / OFF | Show gate opening on the PWA plot. |
| Start Mode | Selects the mode to specify the start of the boxcar averaging gate opening. The phase (deg) is the native mode for the device. | |
| Start (deg) | Native definition of the boxcar averaging gate start as phase. | |
| Start (s) | Definition of the boxcar averaging gate start as time. Due to the conversion to phase on the device a small uncertainty window exists. | |
| Start (deg) | 0 to 360 | Boxcar averaging gate opening start in degrees. It can be converted to time assuming 360 equals to a full period of the driving oscillator. |
| Start Time (s) | 0 to period | Boxcar averaging gate opening start in seconds based on one oscillator frequency period equals 360 degrees. Boxcar must be disabled to edit input field. |
| Width Mode | Selects the mode to specify the width of the boxcar averaging gate opening. The time (s) is the native mode for the device. | |
| Width (deg) | Definition of the averaging gate width as phase. | |
| Width (s) | Native definition of the averaging gate width as time. | |
| Width (pts) | Definition of the averaging gate width in samples. | |
| Width (deg) | 0 to 360 | Boxcar averaging gate opening width in degrees based on one oscillator frequency period equals 360 degrees. Boxcar must be disabled to edit input field. |
| Width (s) | 556 ps to period | Boxcar averaging gate opening width in seconds. It can be converted to phase assuming 360 equals to a full period of the driving oscillator. |
| Width (pts) | Integer value | Boxcar averaging gate opening width in samples at 1.8 GHz rate. |
| Too large gate width | grey/red | Boxcar averaging gate opening width is more than one cycle of the signal and should be reduced. |
| Copy from cursor | Copy from cursor | Take cursor value to define Baseline Start value. |
| Start Mode | Selects the mode to specify the start of the boxcar baseline suppression gate opening. The phase (deg) is the native mode for the device. | |
| Start (deg) | Native definition of the boxcar baseline suppression gate start as phase. | |
| Start (s) | Definition of the boxcar baseline suppression gate start as time. | |
| Offset (deg) | Definition of the boxcar baseline suppression gate start relative to the gate opening start as phase. | |
| Offset (s) | Definition of the boxcar baseline suppression gate start relative to the gate opening start as time. | |
| Start (deg) | 0 to 360 | Boxcar baseline suppression gate opening start in degrees based on one oscillator frequency period equals 360 degrees. |
| Start (s) | 0 to period | Boxcar baseline suppression gate opening start in seconds based on one oscillator frequency period equals 360 degrees. |
| Offset (deg) | 0 to 360 | Boxcar baseline suppression gate opening start in degrees relative to Gate Start. |
| Offset (s) | 0 to period | Boxcar baseline suppression gate opening start in seconds relative to Gate Start. |
| Enable | ON / OFF | Enable Baseline Suppression |
| Averaging Periods | 1 to 2^20 | Number of periods to average. The output will be refreshed up to 512 times during the specified number of periods. This setting has no effect on Output PWAs. |
| Averaging BW | 10 µHz to 7 MHz | The 3 dB signal bandwidth of the Boxcar Averager is determined by the oscillation frequency and the number of averaging periods set. Note: internally the boxcar signal is sampled at a rate of 14 MSa/s and the signal bandwidth of the auxiliary output is 7 MHz. |
| Rate Limit (Sa/s) | 1.0 Sa/s to 3.516 MSa/s | Rate Limit for Boxcar output data sent to PC. This value does not affect the Aux Output for which the effective rate is given by min(14 MSa/s, Frequency / max(1, Averaging Periods/512)). |
| Data Rate (Sa/s) | 0 to 3.516 MSa/s | Display the currently effective rate used for data transfer to the PC given by min(14 MSa/s , Frequency / max(1, Averaging Periods/512)). This value is read-only. |
| Oversampling | Integer value, ideally 0 | Indicates, in powers of 2, the number of averager outputs sent to the PC while Averaging Periods Boxcar integrations are obtained. Positive integer values indicate oversampling. Negative integer values indicate undersampling. Examples for oversampling values: 0 : 2^0 = 1 averager output is sent to the PC during Averaging Periods Boxcar integrations. 2 : 2^2 = 4 averager outputs are sent to the PC during Averaging Periods Boxcar integrations. -1 : 2^-1 = 0.5, only every other Averaging Periods Boxcar integrations an averager output is sent to the PC. |
| Value | numeric value | The current boxcar output. |
| Value Overflow flag | grey/red | Overflow detected. Sticky flag cleared by restarting the boxcar. The boxcar output may not be reliable any more. |
| Sample Loss | grey/red | Data lost during streaming to PC. Sticky flag cleared by restarting the boxcar. |
For the Math sub-tab please see Plot math description in Cursors and Math.