Plotter Tab
The Plotter is one of the powerful time-domain measurement tools as introduced in Unique Set of Analysis Tools and is available on all UHFLI instruments. On UHFAWG instruments, the tab is available if at least one of the options UHF-DIG, UHF-CNT, UHF-BOX, or UHF-LIA is installed.
Features
- Plotting of all streamed data, e.g. demodulator data, auxiliary inputs, auxiliary outputs, Boxcar data, PID, etc.
- Plotting of all streamed data, e.g. demodulator data, auxiliary inputs, auxiliary outputs, etc.
- Plotting of all streamed data, e.g. impedance data, demodulator data, auxiliary inputs, auxiliary outputs, etc.
- Plotting of streamed data from the pulse counters (requires HDAWG-CNT option) or streamed trigger input states.
- Plotting of Scope data, e.g. Signal Inputs (requires UHF-DIG option)
- Vertical axis grouping for flexible axis scaling
- Polar and Cartesian data format
- Histogram and Math functionality for data analysis
- 4 cursors for data analysis
- Support for Input Scaling and Input Units
Description
The Plotter serves as graphical display for time domain data in a roll mode, i.e. continuously without triggering. Whenever the tab is closed or an additional one of the same type is needed, clicking the following icon will open a new instance of the tab.
| Control/Tool | Option/Range | Description |
|---|---|---|
| Plotter | Displays various continuously streamed measurement data as traces over time (roll mode). |
The Plotter tab (see Figure 1) is divided into a display section on the left and a configuration section on the right.
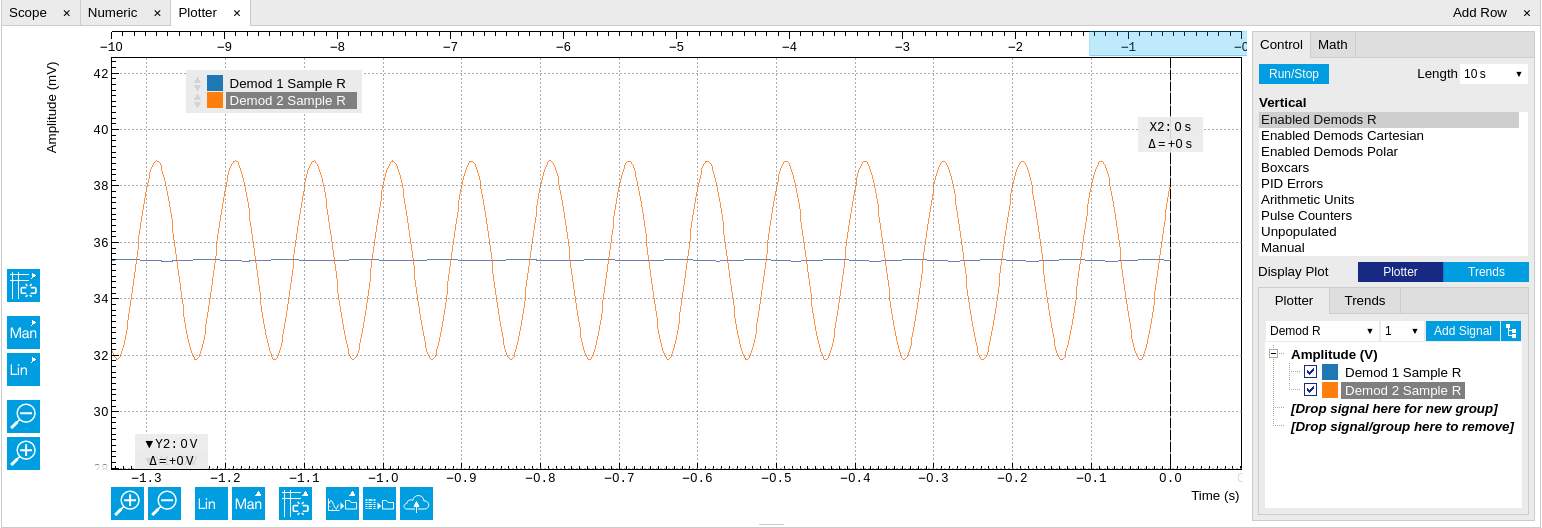
The Plotter can be used to monitor the evolution of demodulated data and other streamed data continuously over time. Just as in the numeric tab any continuously streamed quantity can be displayed, for instance R, Θ, X, Y, frequency, and others. New signals can be added by either using the presets in the Control sub-tab or by going through the tree and selecting the signals of interest in the tree structure. The vertical and horizontal axis can be displayed in Lin, Log or dB scale. The Plotter display can be zoomed in and out with the magnifier symbols, or through Man (Manual), Auto (Automatic) and FS (Full Scale) button settings (see also Plot Functionality). The maximum duration data is kept in the memory can be defined through the window length parameter in the Settings sub-tab. The window length also determines the file size for the Record Data functionality.
Note
Setting the window length to large values when operating at high sampling rates can lead to memory problems at the computer hosting the data server.
The sampling rate of the demodulator data is determined by the Rate value in Sa/s set in the Lock-in tab ; similarly the rates for PID and Boxcar related data are set in the associated tabs . The Plotter data can be continuously saved to disk by clicking the record button in the Config tab which will be indicated by a green Recording (REC) LED in the status bar. See Saving and Loading Data for more information on data saving.
Functional Elements
| Control/Tool | Option/Range | Description |
|---|---|---|
| Run/Stop |  |
Start and stop continuous data plotting (roll mode) |
| Select a Preset | Select a pre-defined group signals. A signal group is defined by a common unit and signal type. They should have the same scaling behavior as they share a y-axis. Split a group if the signals have different scaling properties. |
|
| Enabled Demods R | Selects the amplitude of all enabled demodulators. | |
| Enabled Demods Cartesian | Selects X and Y of all enabled demodulators. | |
| Enabled Demods Polar | Selects amplitude and phase of all enabled demodulators. | |
| Boxcars | Selects the amplitude of boxcar 1 and 2. | |
| PID Errors | Selects the error of all PID. | |
| Arithmetic Units | Selects the output of all Cartesian and polar arithmetic units. | |
| Pulse Counters | Selects the output of all pulse counter units. | |
| Unpopulated | Shows no signals. | |
| Manual | Selects the signals as defined in the tree sub-tab. |
For the Vertical Axis Groups, please see the table "Vertical Axis Groups description" in the section called "Vertical Axis Groups".
For the Math sub-tab please see the table "Plot math description" in the section called "Cursors and Math".