Out PWA Tab
The Out PWA tab relates to the UHF-BOX Boxcar Averager option and is only available if this option is installed on the UHF Instrument (see Information section in the Device tab).
Features
- Period waveform analyzer for boxcar output samples (multi-channel boxcar, deconvolution boxcar)
- Support signals derived from asynchronous optical sampling
Description
The Out PWA tab provides access to the period waveform analyzer that acts on boxcar output samples. This feature is also called multi-channel boxcar or deconvolution boxcar. Whenever the tab is closed or an additional one of the same type is needed, clicking the following icon will open a new instance of the tab.
| Control/Tool | Option/Range | Description |
|---|---|---|
| Out PWA | Multi-channel boxcar settings and measurement analysis for boxcar outputs. |
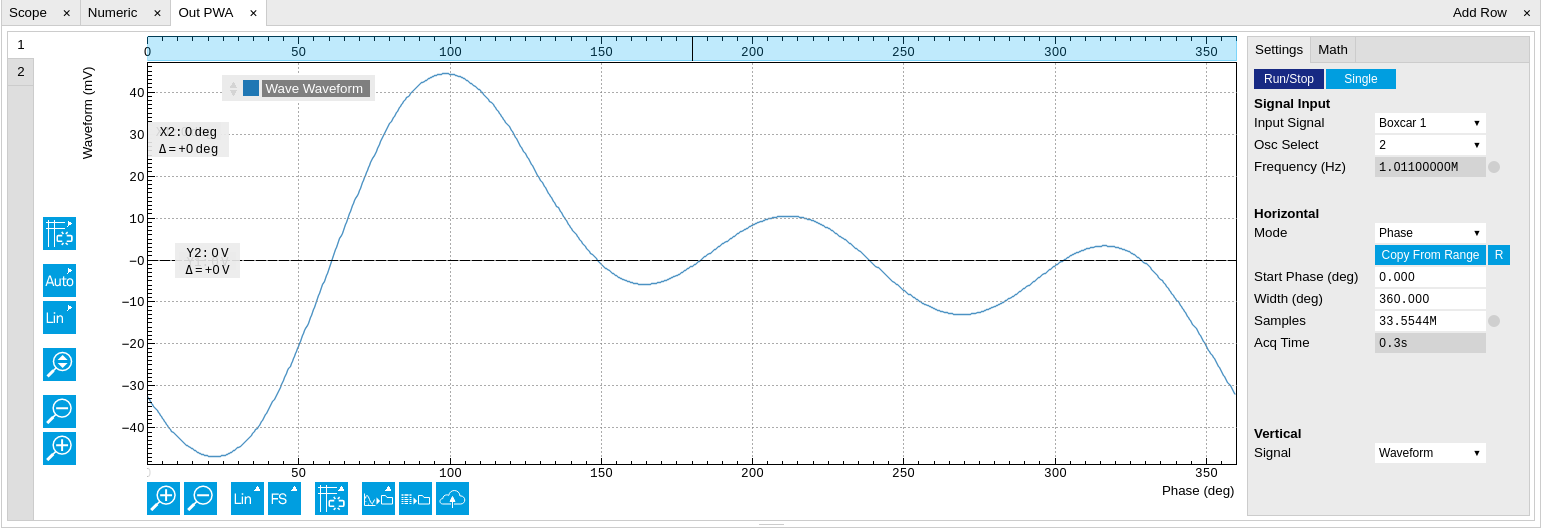
The Out PWA tab (see Figure 1) consists of a display section on the left and a configuration section on the right. The configuration section is further divided into a number of sub-tabs.
The operation of the Output PWA is described in Multi-channel Boxcar Averager in the Tutorials chapter. The Output PWA works analogously to the PWA supplied in the Boxcar tabs (see boxcar tab) except that its inputs are given by the outputs of the two Boxcar units, rather than the Signal Inputs. The Boxcar output is routed to the input of the Output PWA without averaging, which means that the Averaging Periods setting made in the Boxcar tab is irrelevant for the measurement with the Output PWA.
Functional Elements
| Control/Tool | Option/Range | Description |
|---|---|---|
| Run/Stop |  |
Continuously run and stop PWA acquisition. |
| Single |  |
Single acquisition of a PWA data set. |
| Input Signal | Boxcar 2 | Select PWA input signal. |
| Boxcar 1 | ||
| Osc Select | oscillator index | Select reference oscillator for PWA signal acquisition. |
| Frequency | numeric value | Actual frequency at which the PWA operates based on set oscillator frequency and harmonic scaling factor. |
| Commensurability | grey/red | Traffic light showing whether the number of samples acquired is evenly distributed over all bins. |
| Mode | Harmonics (FFT) | Measurement data can be interpreted in four different modes and displayed over either phase (native), time, frequency (FFT) or harmonics of the base frequency (FFT). |
| Phase | ||
| Time | ||
| Freq Domain (FFT) | ||
| Copy from range |  |
Change PWA start and span according to plot range. |
| Reset |  |
Reset the start and width value to show the full 360 deg. |
| Start | numeric value | Defines the start of PWA range in time or phase. |
| Width | numeric value | Defines width of PWA range in time or phase. |
| Samples | 1 to 2^47 | Defines the number of samples acquired of each PWA data set (450 MSa/s). |
| Acq Time (s) | numeric value | Estimated time needed for recording of the specified number of samples. |
| Overflow | grey/red | Indicates whether the number of samples collected per bin or the amplitude exceeds the numerical limit. Reduce number of samples and/or change frequency. |
| Infinite Acq Time | string | The signal source of this unit (Boxcar) is not producing any data. Once it is configured and enabled, this field will indicate the duration of a single measurement. |
| Progress (%) | 0 to 100% | Show state of the PWA acquisition in percent. |
| 3dB Bandwidth | numeric value | 3dB bandwidth in Hz. |
| Max Harmonics | numeric value | Maximum number of displayed harmonics. |
| Signal | Count | Select signal to be displayed. |
| Waveform |
For the Math sub-tab please see Plot math description in Cursors and Math.