Numeric Tab
The Numeric tab provides a powerful time domain based measurement display as introduced in Unique Set of Analysis Tools. It is available on all HF2LI instruments.
Features
- Display of demodulator output data and other streamed data, e.g. auxiliary inputs, demodulator frequencies
- Graphical and numerical range indicators
- Polar and Cartesian formats
- Support for Input Scaling and Input Units
Description
The Numeric tab serves as the main numeric overview display of multiple measurement data. The display can be configured by both choosing the values displayed and also rearrange the display tiles by drag-and-drop. Whenever the tab is closed or an additional one of the same type is needed, clicking the following icon will open a new instance of the tab.
| Control/Tool | Option/Range | Description |
|---|---|---|
| Numeric | Access to all continuously streamed measurement data as numerical values. |
The numeric tab (see Figure 1) is divided into a display section on the left and a configuration section on the right. The configuration section is further divided into a number of sub-tabs.
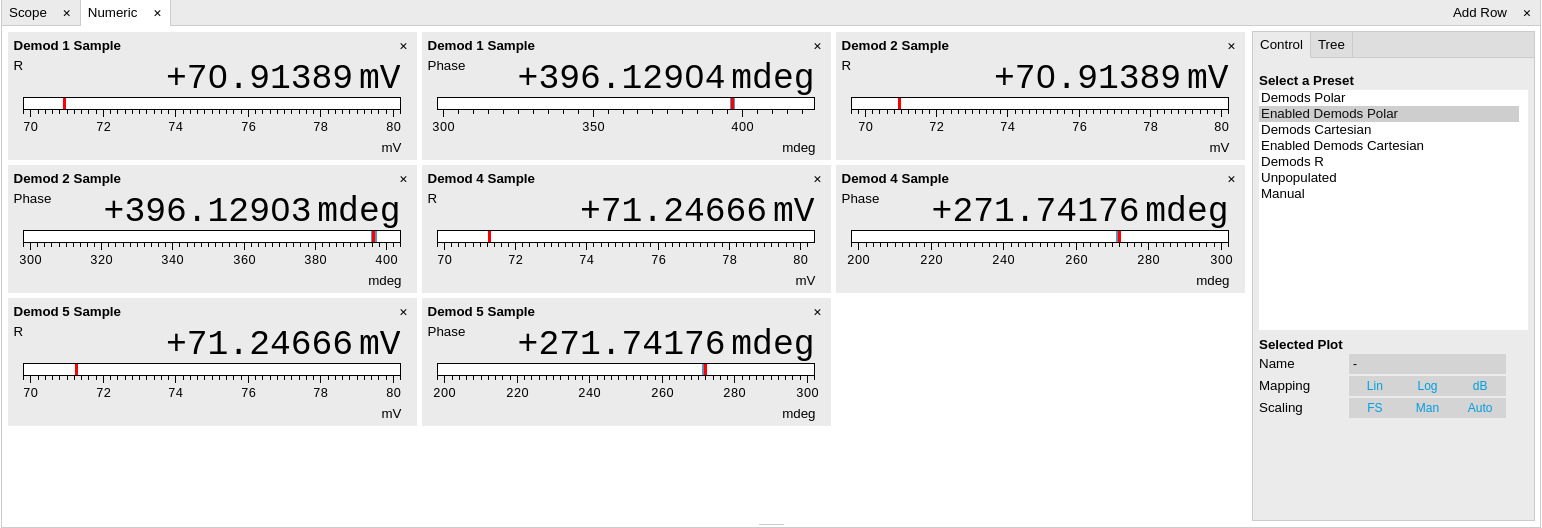
The numeric tab can be deployed to display the demodulated signal, phase, frequency as well as the signal levels at the auxiliary inputs. By default, the user can display the demodulated data either in polar coordinates (R, Θ) or in Cartesian coordinates (X, Y) which can be toggled using the presets. To display other measurement quantities as available from any of the presets simply click on the tree tab next to the preset tab. The desired display fields can be selected under each demodulator’s directory tree structure.
Functional Elements
| Control/Tool | Option/Range | Description |
|---|---|---|
| Select a Preset | Select numerical view based on a preset. Alternatively, the displayed value may also selected based on tree elements. | |
| Demods Polar | Shows R and Phase of all demodulators. | |
| Enabled Demods Polar | Shows R and Phase of enabled demodulators. | |
| Demods Cartesian | Shows X and Y of all demodulators. | |
| Enabled Demods Cartesian | Shows X and Y of enabled demodulators. | |
| Demods R | Shows R of all demodulators. | |
| Unpopulated | Shows no signals. | |
| Manual | If additional signals are added or removed the active preset gets manual. |
For the Tree sub-tab please see the section called "Tree Selector".
| Control/Tool | Option/Range | Description |
|---|---|---|
| Name | text label | Name of the selected plot(s). The default name can be changed to reflect the measured signal. |
| Mapping | Mapping of the selected plot(s) | |
| Lin | Enable linear mapping. | |
| Log | Enable logarithmic mapping. | |
| dB | Enable logarithmic mapping in dB. | |
| Scaling | Manual/Full Scale | Scaling of the selected plot(s) |
| Zoom To Limits |  |
Adjust the zoom to the current limits of the displayed histogram data. |
| Start Value | numeric value | Start value of the selected plot(s). Only visible for manual scaling. |
| Stop Value | numeric value | Stop value of the selected plot(s). Only visible for manual scaling. |