PID / PLL Tab
The PID / PLL tab is only available if the MF-PID Quad PID/PLL Controller option is installed on the MFIA Instrument (the installed options are displayed in the Device tab).
Note
The feedback controllers provide general-purpose PID functionality, phase-locked loop (PLL) functionality, and External Reference functionality. When the user sets one of the demodulators to ExtRef mode (see Lock-in tab, Demodulators section, Mode column), one of the PID controllers will be reserved for that purpose.
Note
Some settings in the PID / PLL tab are interdependent with settings that are accessible from other tabs. If the PID output controls a certain variable, e.g. Signal Output Offset, this variable will be shown as read-only where it appears in other tabs (i.e. in the Lock-in tab for this case).
Features
- Four fully programmable proportional, integral, derivative (PID) controllers
- Two fully programmable 5 MHz / 500 kHz phased-locked loops
- PID / PLL Advisor with multiple DUT models, transfer function, and step function modeling
- Auto Tune: Automatic minimization of the amplitude of the PID error signal
- High speed operation with up to 50 kHz loop filter bandwidth
- Input parameters: demodulator data, auxiliary inputs, auxiliary outputs
- Output parameters: output amplitudes, oscillator frequencies, demodulator phase, auxiliary outputs, signal output offsets
- Phase unwrap for demodulator Θ data (± 1024 π), e.g. for optical phase-locked loops
- Bandwidth limit for the derivative (D) feedback component
- Programmable PLL center frequency and phase setpoint
- Programmable PLL phase detector filter settings
- Auto-zero functions for PLL center frequency and setpoint
- Generation of sub-multiple frequencies by use of harmonic multiplication factor
Description
The PID / PLL tab is the main control center for the feedback loop controllers in the instrument. Whenever the tab is closed or an additional one of the same type is needed, clicking the following icon will open a new instance of the tab.
| Control/Tool | Option/Range | Description |
|---|---|---|
| PID | Features all control, analysis, and simulation capabilities of the PID controllers. |
The PID / PLL tab (see Figure 1) consists of four identical side-tabs, each of them providing access to the functionality of one of the four PID / PLL controllers and the associated PID Advisor.
With their variety of different input and output connections, the LabOne PID controllers are extremely versatile and can be used in a wide range of different applications including laser locking or high-speed SPM. Figure 2 shows a block diagram of all PID controller components, their interconnections and the variables to be specified by the user.

Setting up a Control Loop
Depending on the application there are a number of ways to set up a control loop. Let’s consider a few different approaches and see how the Advisor can help to reduce the effort and improve on the result and understanding of the setup.
Manual Setup
In cases where the transfer function of the device under test (DUT) is unknown and only little noise couples into the system from the environment, a manual approach is often the quickest way to get going. For manual configuration of a new control loop it is recommended to start with a small value for P and set the other parameters (I, D, D Limit) to zero. By enabling the controller one will then immediately see if the sign of P is correct and if the feedback is acting on the correct output parameter for instance by checking the numbers (Error, Shift, Out) displayed in the PID / PLL tab. A stepwise increase of the integral gain I will then help to zero the PID error signal completely. Enabling the derivative gain D can increase the speed of the feedback loop, but it can also cause an instable feedback loop behavior . Monitoring the PID error in the Plotter Tab in parallel can be a great help at this stage. The math tools offered by the Plotter allow us to display the standard deviation and the average value of the error. These values should be minimized by tweaking the PID parameters and the associated histogram should have a symmetric (ideally Gaussian) envelope.
In order to characterize the feedback loop quantitatively, you can measure the step response in the Data Acquisition Tab. To do that measurement, change the PID setpoint manually after you have configured the DAQ Trigger level half way in between the old and new setpoint. DAQ Delay and Duration are chosen to roughly match the expected bandwidth. For a step response curve with fine time resolution, the PID data rate should be high enough.
PID Advisor
For many experimental situations the external device or DUT can be well approximated by a simple model. The LabOne PID Advisor allows you to simulate the behavior of a number of different DUT types in a feedback loop and choose feedback gain parameters based on the simulation. The DUTs are characterized by a model function with a number of parameters found on the Advisor sub-tab. All models include a setting for the delay that occurs outside the instrument. Depending on the targeted servo bandwidth, the external delay can often be the limiting factor and should be sensibly chosen.
Note
The delay specified for each model is the earliest possible response to a stepwise change of the instrument output to be seen on the instrument input. It describes the causality of the system and does not affect the shape of the DUT transfer function. Standard coaxial cables cause a signal delay of about 5 ns/m.
The most simple approach to modeling is to assume a DUT with a unity transfer function by using All Pass. The low-pass filters allow for limiting the bandwidth, to set an overall gain and a damping for the second order filter. With a Gain set to 1 and a Delay set to 0, All Pass can be used to model the PID controller independent of the external device. Resonator Frequency is a model that applies well in situations with a passive external component, e.g. a AFM cantilever or a quartz resonator, whose frequency should be tracked by a PLL over time. In cases where the amplitude of the resonator signal needs to be stabilized with a second control loop (automatic gain control), the Resonator Amplitude model is the right choice. Setting the resonance frequency and the Q factor, both can be obtained before by a frequency scan over the resonance using the Sweeper Tab, allows the Advisor to estimate the gain and low-pass behavior of the resonator. Internal PLL is used whenever an external oscillating signal is provided that shall be followed by one of the internal oscillators. The VCO setting describes a situation where the input variable of the DUT is a voltage and the output is a frequency. The gain parameter specifies how much voltage change on the input causes how much frequency shift on the VCO output. In case the frequency of the VCO can be tracked by using the external reference mode, one can easily measure this gain with the Sweeper Tab by scanning the Auxiliary Output voltage and displaying the resulting oscillator frequency. The gain is given by the slope of the resulting line at the frequency of interest.
With a model and parameters set to best describe the actual measurement
situation, one can now continue by defining a target bandwidth for the
entire control loop and the Advise Mode, i.e. the feedback gain
parameters that shall be used for the control operation. Whenever the
input signal is derived from one of the demodulators it is convenient to
activate the box next to target bandwidth. With that in place the Advise
algorithm will automatically adjust the demodulator bandwidth to a value
about 5 times higher than the target bandwidth in order to avoid to be
limited by demodulation speed. The Advisor algorithm will now calculate
a target step response function that it will try to achieve by adjusting
the feedback gain parameters in the next step. Before doing so in case
of a newly set up DUT model, the algorithm will first try to estimate
the PID parameters by using the Ziegler-Nichols method. When there has
been a previous run, the user can also change the parameters in the
model manually which will the be used as new start parameters of the
next Advise run. Starting from the initial parameters, the Advisor will
then perform a numerical optimization in order to achieve a
least-squares fit of the calculated step response to a target step
response determined from the Target Bandwidth. The result is numerically
characterized by an achieved bandwidth (BW) and a phase margin (PM).
Moreover, the large plot area on the right can be used to characterize
the result by displaying transfer functions, magnitude and phase, and
step responses between different signal nodes inside the loop. Once the
modeling is completed one can copy the resulting parameters to the
physical PID by clicking on  .
.
| Name | Function | Parameters |
|---|---|---|
| All pass | \(H(s)=g\) |
|
| Low-pass 1st | \(H(s)=g\frac{1}{t_c s + 1} = g\frac{\omega_n}{s +\omega_n}\) |
|
| Low-pass 2nd | \(H(s)=g\frac{\omega^2_n}{s^2+2\omega_n\zeta s+\omega^2_n}\) |
|
| Resonator frequency | \(H(s)= -360^{\circ} \frac{t_c}{t_c s+1}\) with \(t_c=\frac{1}{2\pi BW}=\frac{2Q}{2\pi f_{res}}\) |
|
| Resonator amplitude | \(H(s)=g\frac{\omega / (2Q)}{s+\omega /(2Q)}\) with \(\omega=2\pi f_{res}\) |
|
| Internal PLL | \(H(s)=-\frac{360^\circ}{s}\) | |
| VCO | \(H(s)=g\frac{360^\circ}{s(t_c s+1)}\) with \(t_c=\frac{1}{2\pi f_{res}}\) |
|
Note
It is recommended to use the Advisor in a stepwise approach where one increases the free parameters from P to PI, to PID . This can save time because it prevents optimizing into local minima. Also it can be quite illustrative to see which of the feedback parameters leads to which effect in the feedback behavior.
Note
The low-pass filter in the differential part is implemented as an exponential moving average filter described by \(y_t=(1-\alpha)\cdot y_{t-1}+\alpha x_t\) with \(\alpha = 2^{-dshift}\), \(x_t\) the filter input, and \(y_t\) the filter output. The default value for dshift is 0 which corresponds to a disabled filter. On the UI the filter properties can be changed in units of bandwidth or a time constant.
In case the feedback output is a voltage applied to sensitive external equipment it is recommended to make use of the center value and the upper and lower limit values. This will guarantee that the output stays in the defined range even when the lock fails and the integrator goes into saturation.
Auto Tune
The Auto Tune feature found on the Tuner sub-tab can now help to minimize the residual error signal. Auto Tune will vary the feedback gain parameters, as selected in the Advise Mode field in the Advisor sub-tab, in order to minimize the root mean square of the PID error signal. Being based on measurement, Auto Tune can often improve on the results of the model-based PID Advisor because it can take into account the real experimental noise and device transfer function. For Auto Tune to deliver good results, it should be applied in the actual operating conditions of the PID loop, as otherwise the PID bandwidth may end up too low. E.g. it makes no sense to apply Auto Tune to a PLL on a lifted AFM cantilever when the PLL later is used to track the cantilever during scanning.
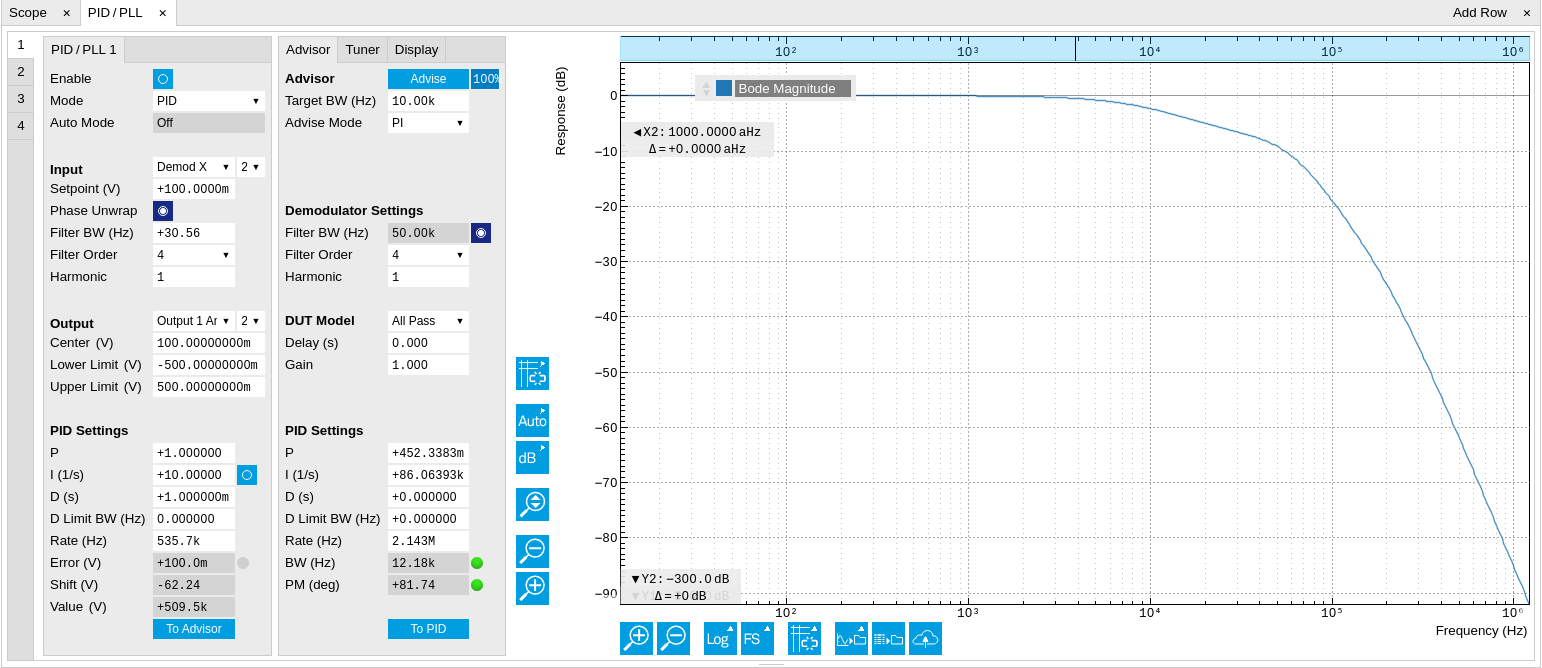
The transfer function of the chosen PID settings can always be checked
by copying the values to the Advisor by clicking the  button
and selecting the Advanced Mode in the Display sub-tab. With the
Response In set to Setpoint, the Response Out set to PID Output and with
Closed-Loop deactivated one can visualize the Bode Magnitude of the PID
controller’s transfer function. This graph is what is usually shown in
textbooks and is independent of the model function chosen in the DUT
section. However, in order to simulate step responses or to calculate a
bandwidth, a suitable model for the entire loop is required.
button
and selecting the Advanced Mode in the Display sub-tab. With the
Response In set to Setpoint, the Response Out set to PID Output and with
Closed-Loop deactivated one can visualize the Bode Magnitude of the PID
controller’s transfer function. This graph is what is usually shown in
textbooks and is independent of the model function chosen in the DUT
section. However, in order to simulate step responses or to calculate a
bandwidth, a suitable model for the entire loop is required.
Setting up a phase-locked loop (PLL)
The PID controllers 1 and 2 can be set to PLL mode which the Mode selector. Changing to PLL mode sets the PID controller input to a demodulator phase, the PID controller output to the frequency of an internal oscillator, and changes some of the parameters to appropriate default values. Figure 3 shows a block diagram of a PLL with its components, their interconnections and the variables to be specified by the user. The demodulator and the PID controller are slightly simplified for this sketch. Their full detailed block diagrams are given in Demodulator block diagram without MF-MD Multi-demodulator option, Demodulator block diagram with MF-MD Multi-demodulator option, and Figure 2 respectively.

In a typical procedure to set up a PLL one would first define the center
frequency, frequency limits, and the phase setpoint in the left section.
If the frequency is not known beforehand, it can often be determined
using the Sweeper or Spectrum tool. Then one would set a target
bandwidth in the Advisor section and click on the Advise button. The
feedback parameters calculated by the Advisor will be shown in the
fields just below. A graphical representation of the calculated transfer
function is shown in the plot on the right-hand side. Once satisfied
with the result, one can transfer the values to the instrument by
clicking the
button, and then enable the PLL. If the Error/PLL Lock field now
displays very small values, the phase lock was successful. One can now
iterate the process and e.g. play with the target bandwidth in the PLL
Advisor to calculate a new set of feedback parameters. Displaying the
oscillator frequency in the Plotter along with a Histogram and Math
function (e.g. standard deviation) can help to quantify the residual
phase error and further improve the lock performance by manual tweaking.
Note
The span set by the PLL frequency limits should exceed the target bandwidth by a factor of 5 to 10 or more.
Note
In the PID/PLL tab you select which of the demodulators you use as a phase detector. Open the Lock-in tab to check if the right Signal Input is associated with the demodulator in use.
Functional Elements
| Control/Tool | Option/Range | Description |
|---|---|---|
| Enable | ON / OFF | Enable the PID controller |
| Mode | Operation mode of the PID module. | |
| PID | The PID is used for a general application. | |
| PLL | The PID is used to control an internal oscillator. | |
| ExtRef | The PID is used by the external reference to control an internal oscillator. | |
| Auto Mode | This defines the type of automatic adaptation of parameters in the PID. | |
| Off | No automatic adaptation. | |
| PID Coeff | The coefficients of the PID controller are automatically set. | |
| Coeff + BW (low) | The PID coefficients, the filter bandwidth and the output limits are automatically set using a low bandwidth. | |
| Coeff + BW (high) | The PID coefficients, the filter bandwidth and the output limits are automatically set using a high bandwidth. | |
| Adaptive | All parameters of the PID including the center frequency are adapted. | |
| Input | Select input source of PID controller | |
| Demodulator X | Demodulator cartesian X component | |
| Demodulator Y | Demodulator cartesian Y component | |
| Demodulator R | Demodulator magnitude component | |
| Demodulator Theta | Demodulator phase | |
| Aux Input | Auxiliary Input | |
| Aux Output | Internal value of Auxiliary Output | |
| TU Output Value | Output value of TU logic unit | |
| Input Channel | index | Select input channel of PID controller. |
| Setpoint | numeric value | PID controller setpoint |
| Phase Unwrap | ON / OFF | Enables the phase unwrapping to track phase errors past the +/-180 degree boundary and increase PLL bandwidth. |
| Filter BW | numeric value | Bandwidth of the demodulator filter used as an input. |
| Filter Order | Selects the filter roll off between 6 dB/oct and 48 dB/oct of the current demodulator. | |
| 1 | 1st order filter 6 dB/oct | |
| 2 | 2nd order filter 12 dB/oct | |
| 3 | 3rd order filter 18 dB/oct | |
| 4 | 4th order filter 24 dB/oct | |
| 5 | 5th order filter 30 dB/oct | |
| 6 | 6th order filter 36 dB/oct | |
| 7 | 7th order filter 42 dB/oct | |
| 8 | 8th order filter 48 dB/oct | |
| Harmonic | 1 to 1023 | Multiplier of the for the reference frequency of the current demodulator. |
| Output | Select output of the PID controller | |
| Sig Out 1 Amplitude | Feedback to the main signal output amplitude 1 | |
| Sig Out 2 Amplitude | Feedback to the main signal output amplitude 2 | |
| Oscillator Frequency | Feedback to any of the internal oscillator frequencies | |
| Demodulator Phase | Feedback to any of the 8 demodulator phase set points | |
| Aux Output Offset | Feedback to any of the 4 Auxiliary Output's Offset | |
| Signal Output Offset | Feedback to the main Signal Output offset adjustment | |
| Output Channel | index | Select output channel of PID controller. |
| Center | numeric value | After adding the Center value to the PID output, the signal is clamped to Center + Lower Limit and Center + Upper Limit. |
| Lower Limit | numeric value | After adding the Center value to the PID output, the signal is clamped between Center + Lower Limit, and Center + Upper Limit. In order for the Center value to be within the signal range, the Lower Limit and the Upper Limit must be negative and positive, respectively. |
| Upper Limit | numeric value | After adding the Center value to the PID output, the signal is clamped between Center + Lower Limit, and Center + Upper Limit. In order for the Center value to be within the signal range, the Lower Limit and the Upper Limit must be negative and positive, respectively. |
| P | numeric value | PID proportional gain P |
| I/Ti | numeric value | Integral gain coefficient I or time constant Ti where Ti=P/I. |
| D/Td | numeric value | Derivative gain coefficient D or time constant Td where Td=D/P. |
| D Limit TC/BW 3 dB | 673 ns to 15 ms/10 Hz to 236 kHz | The cutoff of the low-pass filter for the D limitation, shown as either the filter time constant or the 3 dB cutoff frequency, depending on the selected TC mode. When set to 0, the low-pass filter is disabled. |
| Rate | 3.7 Hz to 469 kHz | PID sampling rate and update rate of PID outputs. Needs to be set substantially higher than the targeted loop filter bandwidth. The numerical precision of the controller is influenced by the loop filter sampling rate. If the target bandwidth is below 1 kHz is starts to make sense to adjust this rate to a value of about 100 to 500 times the target bandwidth. If the rate is set too high for low bandwidth applications, integration inaccuracies can lead to non linear behavior. |
| Error | numeric value | Error = Set point - PID Input |
| Lock LED | grey/green | Indicates when the PID (configured as PLL) is locked. The PLL error is sampled at 5 Sa/s and its absolute value is calculated. If the result is smaller than 5 degrees the loop is considered locked. Only works if mode is PLL or ExtRef. |
| Shift | numeric value | Difference between the current output value Out and the Center. Shift = P*Error + I*Int(Error, dt) + D*dError/dt |
| Value | numeric value | Current output value |
| Enable | Enable the relock functionality of the PID controller. | |
| Trigger Source | Selects the trigger input for the relock functionality. | |
| PID Output Overload | Trigger event occurs when the PID output value reaches the set range (center + lower limit, center + upper limit) | |
| Threshold Unit 1 | Threshold Unit 1 output | |
| Threshold Unit 2 | Threshold Unit 2 output | |
| Threshold Unit 3 | Threshold Unit 3 output | |
| Threshold Unit 4 | Threshold Unit 4 output | |
| Trigger Mode | Selects the trigger mode. | |
| Level | As long as the trigger source remains high, the relock is triggered. | |
| Edge | As soon as the trigger source changes from low to high (rising edge), the relock is triggered. | |
| Reset Integrator | Enable the reset of integrated error when the trigger event occurs. | |
| Reset Phase Unwrap | Enable the reset of unwrapped phase when the trigger event occurs. | |
| To Advisor | |
Copy the current PID settings to the PID Advisor. |
| Control/Tool | Option/Range | Description |
|---|---|---|
| Advise |  |
Calculate the PID coefficients based on the used DUT model and the given target bandwidth. If optimized values can be found the coefficients are updated and the response curve is updated on the plot. Only PID coefficients specified with the advise mode are optimized. The Advise mode can be used incremental, means current coefficients are used as starting point for the optimization unless other model parameters are changed in-between. |
| Progress | The percentage of design algorithm already done when the Advisor is in progress. | |
| Target BW (Hz) | numeric value | Target bandwidth for the closed loop feedback system which is used for the advising of the PID parameters. This bandwidth defines the trade-off between PID speed and noise. |
| Advise Mode | Select the PID coefficients that are optimized. The other PID coefficients remain unchanged but are used during optimization. This enables keeping selected coefficients at a fixed value while optimizing the rest. The advise time will increase significantly with the number of parameters to be optimized. |
|
| P | Only optimize the proportional gain. | |
| I | Only optimize the integral gain. | |
| PI | Only optimize the proportional and the integral gain. | |
| PID | Optimize the proportional, integral, and derivative gains. | |
| PIDF | Optimize the proportional, integral, and derivative gains. Also the derivative gain bandwidth will be optimized. | |
| Filter BW | numeric Value | Defines the low-pass filter characteristic of the selected demodulator input. |
| Auto Bandwidth | ON / OFF | Adjusts the demodulator bandwidth to fit best to the specified target bandwidth of the full system. If disabled, a demodulator bandwidth too close to the target bandwidth may cause overshoot and instability. In special cases the demodulator bandwidth can also be selected smaller than the target bandwidth. |
| Filter Order | Selects the filter roll off between 6 dB/oct and 48 dB/oct of the modelled demodulator. | |
| 1 | 1st order filter 6 dB/oct | |
| 2 | 2nd order filter 12 dB/oct | |
| 3 | 3rd order filter 18 dB/oct | |
| 4 | 4th order filter 24 dB/oct | |
| 5 | 5th order filter 30 dB/oct | |
| 6 | 6th order filter 36 dB/oct | |
| 7 | 7th order filter 42 dB/oct | |
| 8 | 8th order filter 48 dB/oct | |
| Harmonic | 1 to 1023 | Multiplier of the for the reference frequency of the modelled demodulator. |
| DUT Model | Type of model used for the external device to be controlled by the PID. A detailed description of the transfer function for each model is found in the previous section. |
|
| All Pass | The external device is modelled by an all pass filter. Parameters to be configured are delay and gain. | |
| LP 1st | The external device is modelled by a first-order low-pass filter. Parameters to be configured are delay, gain and filter bandwidth. | |
| LP 2nd | The external device is modelled by a second-order low-pass filter. Parameters to be configured are delay, gain, resonance frequency and damping ratio. | |
| Resonator Frequency | The external device is modelled by a resonator. Parameters to be configured are delay, center frequency and quality factor. | |
| Internal PLL | The DUT is the internal oscillator locked to an external signal through a phase-locked loop. The parameter to be configured is the delay. | |
| VCO | The external device is modelled by a voltage controlled oscillator. Parameters to be configured are delay, gain and bandwidth. | |
| Resonator Amplitude | The external device is modelled by a resonator. Parameters to be configured are delay, gain, center frequency and quality factor. | |
| Delay | numeric value | Parameter that determines the earliest response for a step change. This parameter does not affect the shape of the DUT transfer function. |
| Gain | numeric value | Parameter that determines the gain of the DUT transfer function. |
| BW (Hz) | numeric value | Parameter that determines the bandwidth of the first-order low-pass filter respectively the bandwidth of the VCO. |
| Damping Ratio | numeric value | Parameter that determines the damping ratio of the second-order low-pass filter. |
| Res Freq | numeric value | Parameter that determines the resonance frequency of the of the modelled resonator. |
| Q | numeric value | Parameter that determines the quality factor of the modelled resonator. |
| P | numeric value | Proportional gain P coefficient used for calculation of the response of the PID model. The parameter can be optimized with PID advise or changed manually. The parameter only gets active on the PID after pressing the button To PLL. |
| I/Ti | numeric value | Integral gain coefficient I or time constant Ti=P/I used for calculation of the response of the PID model. The parameter can be optimized with PID advise or changed manually. The parameter only gets active on the PID after pressing the button To PLL. |
| D/Td | numeric value | Integral gain coefficient D or time constant Td=D/P used for calculation of the response of the PID model. The parameter can be optimized with PID advise or changed manually. The parameter only gets active on the PID after pressing the button To PLL. |
| D Limit TC/BW 3 dB | numeric value | The cutoff of the low-pass filter for the D limitation, shown as either the filter time constant or the 3 dB cutoff frequency, depending on the selected TC mode. When set to 0, the low-pass filter is disabled. |
| Rate | 3.7 Hz to 469 kHz | PID sampling rate used for simulation. The advisor will update the rate to match with the specified target bandwidth. A sampling rate close to the target bandwidth and excessive higher bandwidth will results in a simulation mismatch. |
| BW (Hz) | numeric value | Simulated bandwidth of the full close loop model with the current PID settings. This value should be larger than the target bandwidth. |
| Target BW LED | green/red | Green indicates that the target bandwidth can be achieved. For very high PID bandwidth the target bandwidth might be only achieved using marginal stable PID settings. In this case, try to lower the bandwidth or optimize the loop delays of the PID system. |
| PM (deg) | numeric value | Simulated phase margin of the PID with the current settings. The phase margin should be greater than 45 deg for internal PLL and 60 deg for all other DUT for stable conditions. An Infinite value is shown if no unity gain crossing is available to determine a phase margin. |
| Stable LED | green/red | Green indicates that the phase margin is fulfilled and the PID system should be stable. |
| To PID | |
Copy the PID Advisor settings to the PID. |
| Control/Tool | Option/Range | Description |
|---|---|---|
| Auto Tune |  |
Optimize the PID parameters so that the noise of the closed-loop system gets minimized. The tuning method needs a proper starting point for optimization (away from the limits). The tuning process can be interrupted and restarted. The tuning will try to match the PID bandwidth with the loop bandwidth of the DUT, signal input (demodulator), and signal output. |
| Mode | Select the PID coefficients that are optimized. The other PID coefficients remain unchanged but are used during optimization. This allows to force coefficients to a value while optimizing the rest. | |
| P | Only optimize the proportional gain. | |
| I | Only optimize the integral gain. | |
| PI | Only optimize the proportional and the integral gain. | |
| PID | Optimize the proportional, integral, and derivative gains. | |
| PIDF | Optimize the proportional, integral, and derivative gains. Also the derivative gain bandwidth will be optimized. | |
| Advanced Mode | ON / OFF | Enables manual selection of tuner averaging and setpoint toggling. |
| Iteration Time | numeric Value | Set the length for a tuner optimization iteration. |
| Enable | ON / OFF | Enables the setpoint toggle |
| Alt Setpoint | numeric Value | Defines the second setpoint used for the setpoint toggle. |
| Toggle Rate | numeric Value | Defines the rate of setpoint toggling. Note that possible values are logarithmically spaced with a factor of 4 between values. |
| Control/Tool | Option/Range | Description |
|---|---|---|
| Advanced Mode | ON / OFF | Enables manual selection of display and advice properties. If disabled the display and advise settings are automatically with optimized default values. |
| Display | Select the display mode used for rendering the system frequency or time response. | |
| Bode Magnitude | Display the Bode magnitude plot. | |
| Bode Phase | Display the Bode phase plot. | |
| Step Resp | Display the step response plot. | |
| Start (Hz) | numeric value | Start frequency for Bode plot display. For disabled advanced mode the start value is automatically derived from the system properties and the input field is read-only. |
| Stop (Hz) | numeric value | Stop frequency for Bode plot display. For disabled advanced mode the stop value is automatically derived from the system properties and the input field is read-only. |
| Start (s) | numeric value | Start time for step response display. For disabled advanced mode the start value is zero and the field is read-only. |
| Stop (s) | numeric value | Stop time for step response display. For disabled advanced mode the stop value is automatically derived from the system properties and the input field is read-only. |
| Transfer Function Selector | Selection of the displayed transfer function of the loop. 2 presets and a manual selection are possible. In closed loop configuration all elements from output to input will be included as feedback elements. | |
| System | From Setpoint to System Output. | |
| PID | From Setpoint to PID Output. | |
| Manual | Any transfer function in the open or closed loop can be visualized. | |
| Response In | Start point for the plant response simulation for open or closed loops. In closed loop configuration all elements from output to input will be included as feedback elements. | |
| Demod Input | Start point is at the demodulator input. | |
| Setpoint | Start point is at the setpoint in front of the PID. | |
| PID Output | Start point is at PID output. | |
| Instrument Output | Start point is at the instrument output. | |
| DUT Output | Start point is at the DUT output and instrument input. | |
| Response Out | End point for the plant response simulation for open or closed loops. In closed loop configuration all elements from output to input will be included as feedback elements. | |
| PID Output | End point is at PID output. | |
| Instrument Output | End point is at the instrument output. | |
| DUT Output | End point is at the DUT output and instrument input. | |
| Demod Input | End point is at the demodulator input. | |
| System Output | End point is at the output of the controlled system. | |
| Closed-Loop | ON / OFF | Switch the display of the system response between closed or open loop. |
| Display Form | Switch between display of gain parameters (I and D) and time constants (Ti and Td) for the integral and differential parts. The following relations hold: Ti=P/I and Td=D/P. The switch is active when P and I are non-zero. | |
| PID | Direct coefficients P, I, and D are displayed. | |
| TC | Time Constant of integral (Ti) and derivative (Td) operators are displayed. | |
| Set Output Limits | ON / OFF | Switch the writing of PID limits when 'To PID' is pressed. Only applies in case of Internal PLL and Resonator Freq. |
| Advisor Link |  |
Automatically copy cursor values displayed below to the PID advisor. To enable cursor helpers, switch Advanced Mode on and set Display to Bode Magnitude with PID Transfer Function. Cursors will be displayed in Log and dB axis scale combinations. |
| P | Cursor value representing PID proportional gain P. Drag the plot cursor with the mouse pointer or directly insert numerical value here. | |
| I | Cursor value representing PID integral gain I. Drag the plot cursor with the mouse pointer or directly insert numerical value here. | |
| D | Cursor value representing PID derivative gain D. Drag the plot cursor with the mouse pointer or directly insert numerical value here. | |
| Max Rate (Sa/s) | 1 to 469 kSa/s | Target Rate for PID output data sent to PC. This value defines the applied decimation for sending data to the PC. It does not affect any other place where PID data are used. |
| Data Rate (Sa/s) | Actual data transfer rate of the PID stream data sent to PC. It is defined based on Max Rate. | |
| Stream Overflow Indicator | Indicates an overflow in the stream. |