Quantum Analyzer Result Tab
The Quantum Analyzer Result tab is the interface to the Result Logger unit of the Instrument and displays processed data after the qubit measurement unit (see Functional Overview for an overview block diagram). It is available on all SHFQA+ Instruments.
Features
- Configure result source, result length and averaging
- Display readout results in Readout and Spectroscopy mode with different coordinates
Description
| Control/Tool | Option/Range | Description |
|---|---|---|
| QA Result | Configure the Result Logger. |
The Quantum Analyzer Result tab (see Figure 1) is divided into a display section on the left and a configuration section on the right.
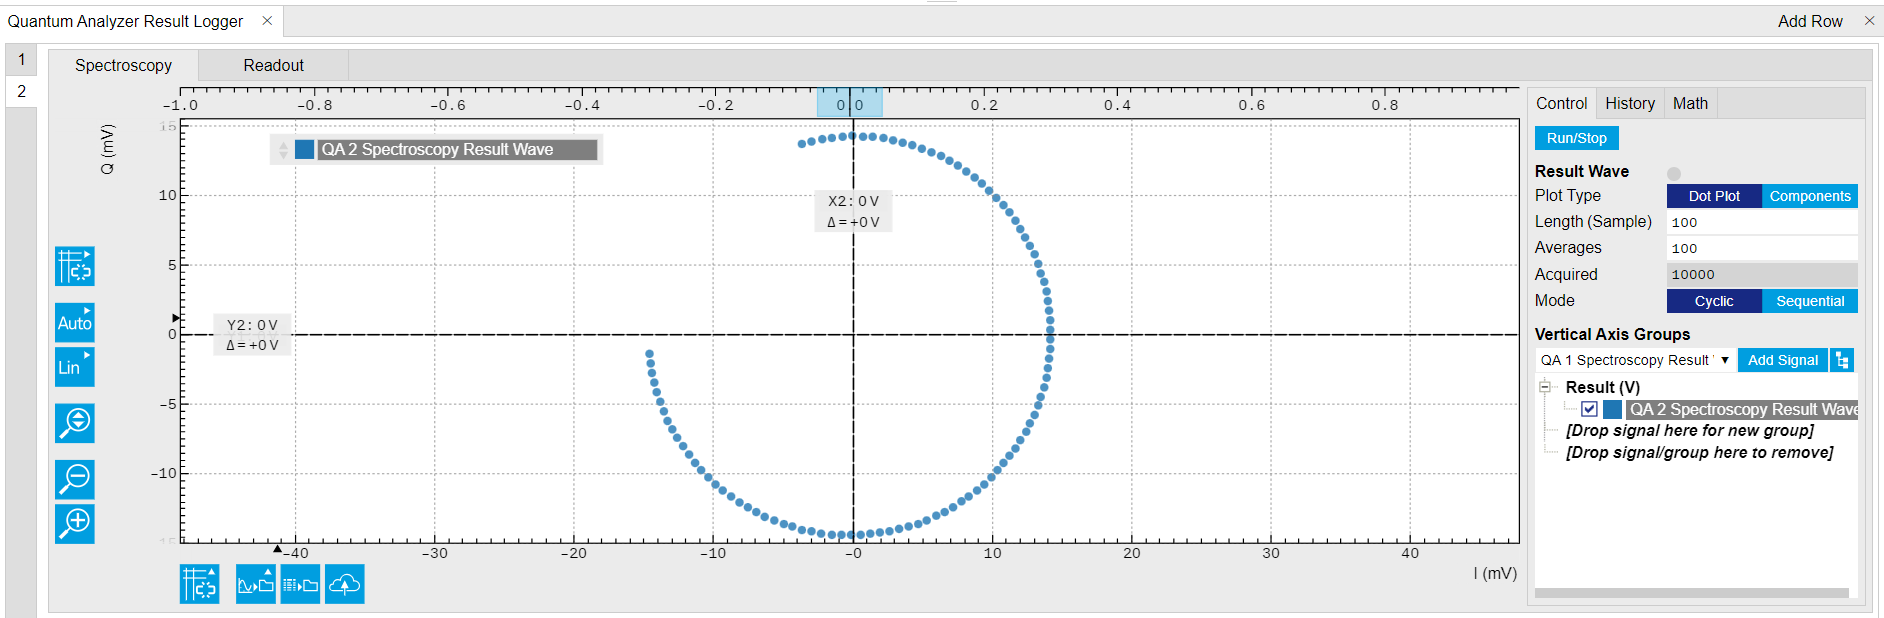
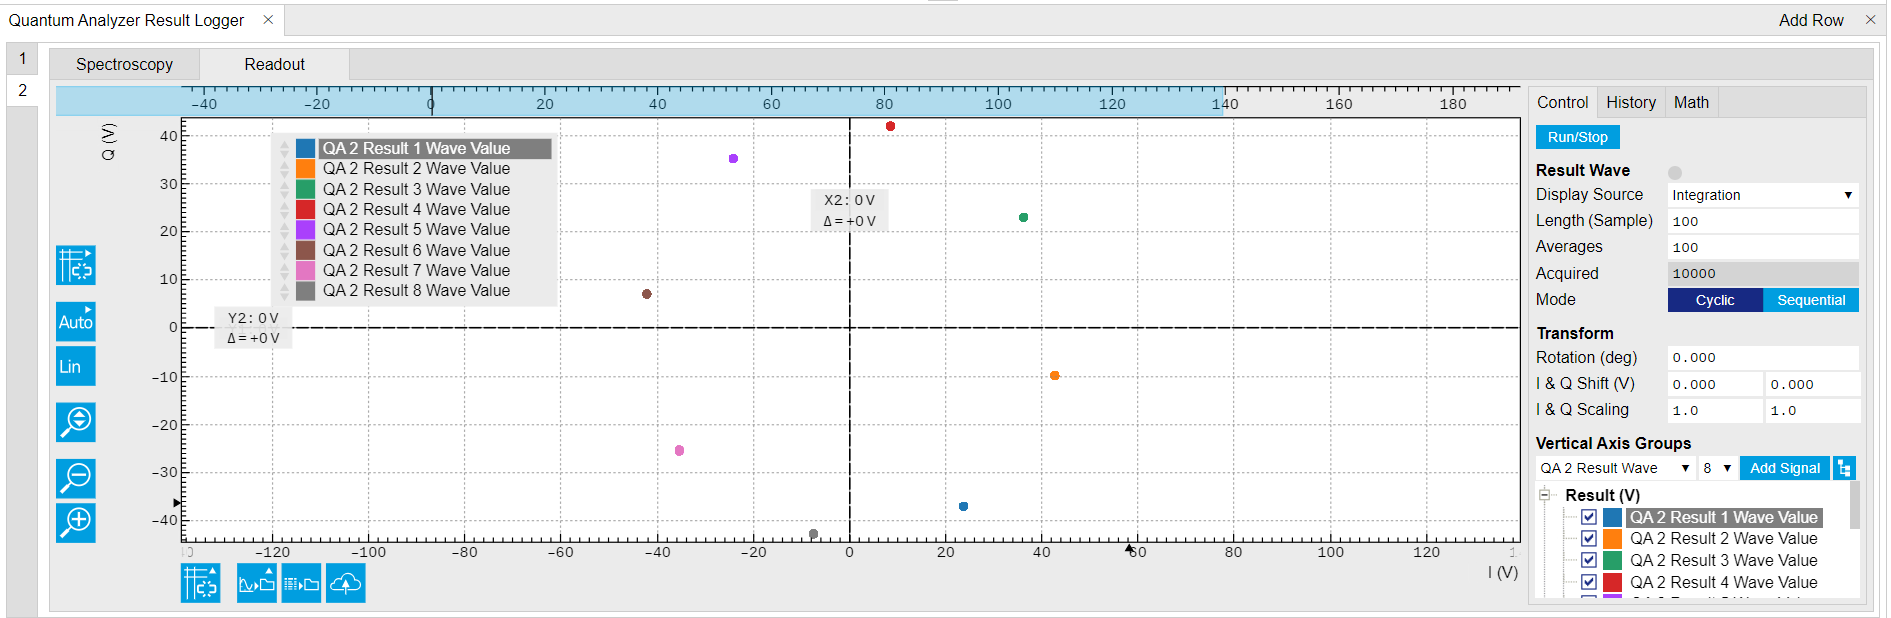
This tool allows users to acquire, average, and analyze large sets of data sourced at various points of the signal processing chain. The data source setting is listed in Table 2
The data are stored in a vector with a length of up to \(2^{19}\) points and displayed in the plot area on the left once the acquisition is complete. The Result Logger supports hardware averaging and 2 averaging modes. The complex readout result after integration can be displayed in different coordinates, i.e. complex plane (IQ plane), amplitude and different coordinates, i.e. complex plane (IQ plane), amplitude and phase versus measurement points.
Note that the QA Result Logger will be turned off automatically only if
the number of acquired data equals the product of the Length and the
Averages set in the tab. A timeout error may occur if the QA Result
Logger does not receive enough trigger events, e.g. if the number of
readouts configured in the Sequencer is less than the product of the
Length and Averages, or if the readout repetition rate exceeds
1/(440 ns) (including the minimum integration hold off time of 20 ns).
Functional Elements
| Control/Tool | Option/Range | Description |
|---|---|---|
| Spectroscopy | Configure Result Logger and display result from Spectroscopy mode. | |
| Readout | Configure Result Logger and display result from Readout mode. | |
| Run/Stop | Run/Stop the Result Logger. | |
| Plot Type | Dot Plot or Components | Select between dot plot in IQ plane or components plot (I, Q, amplitude and phase) in Spectroscopy sub-tab. |
| Length | \(2^0\) to \(2^{19}\) | Number of data points to record. One data point corresponds to a single averaged output of the selected source. The granularity is 1. |
| Averages | \(2^0\) to \(2^{17}\) | Number of averages per recorded data point. The granularity is 1. |
| Acquired | Length x Averages |
Indicate the index of the data point that will be recorded next. |
| Mode | Cyclic or Sequential | Select Cyclic or Sequential averaging. With Cyclic averaging, the first point of the Result vector is the average of the results number 1, M+1, 2M+1, and so forth, where M is equal to the Length setting. The second point is the average of the results number 2, M+2, 2M+2, and so forth. With Sequential averaging, the first point of the Result vector is the average of the first N results, where N is equal to the Averages setting. The second point of the Result vector is the average of the following N results, and so forth. |
| Display Source | Integration or Threshold | Data or averaged data after weighted integration (Integration) or state discrimination (Threshold). |