Inputs/Outputs Tab
The In / Out tab provides access to the settings of the Instrument’s main Signal Inputs and Signal Outputs. It is available on all SHFQA+ Instruments.
Features
- Signal input configuration
- Signal output configuration
Description
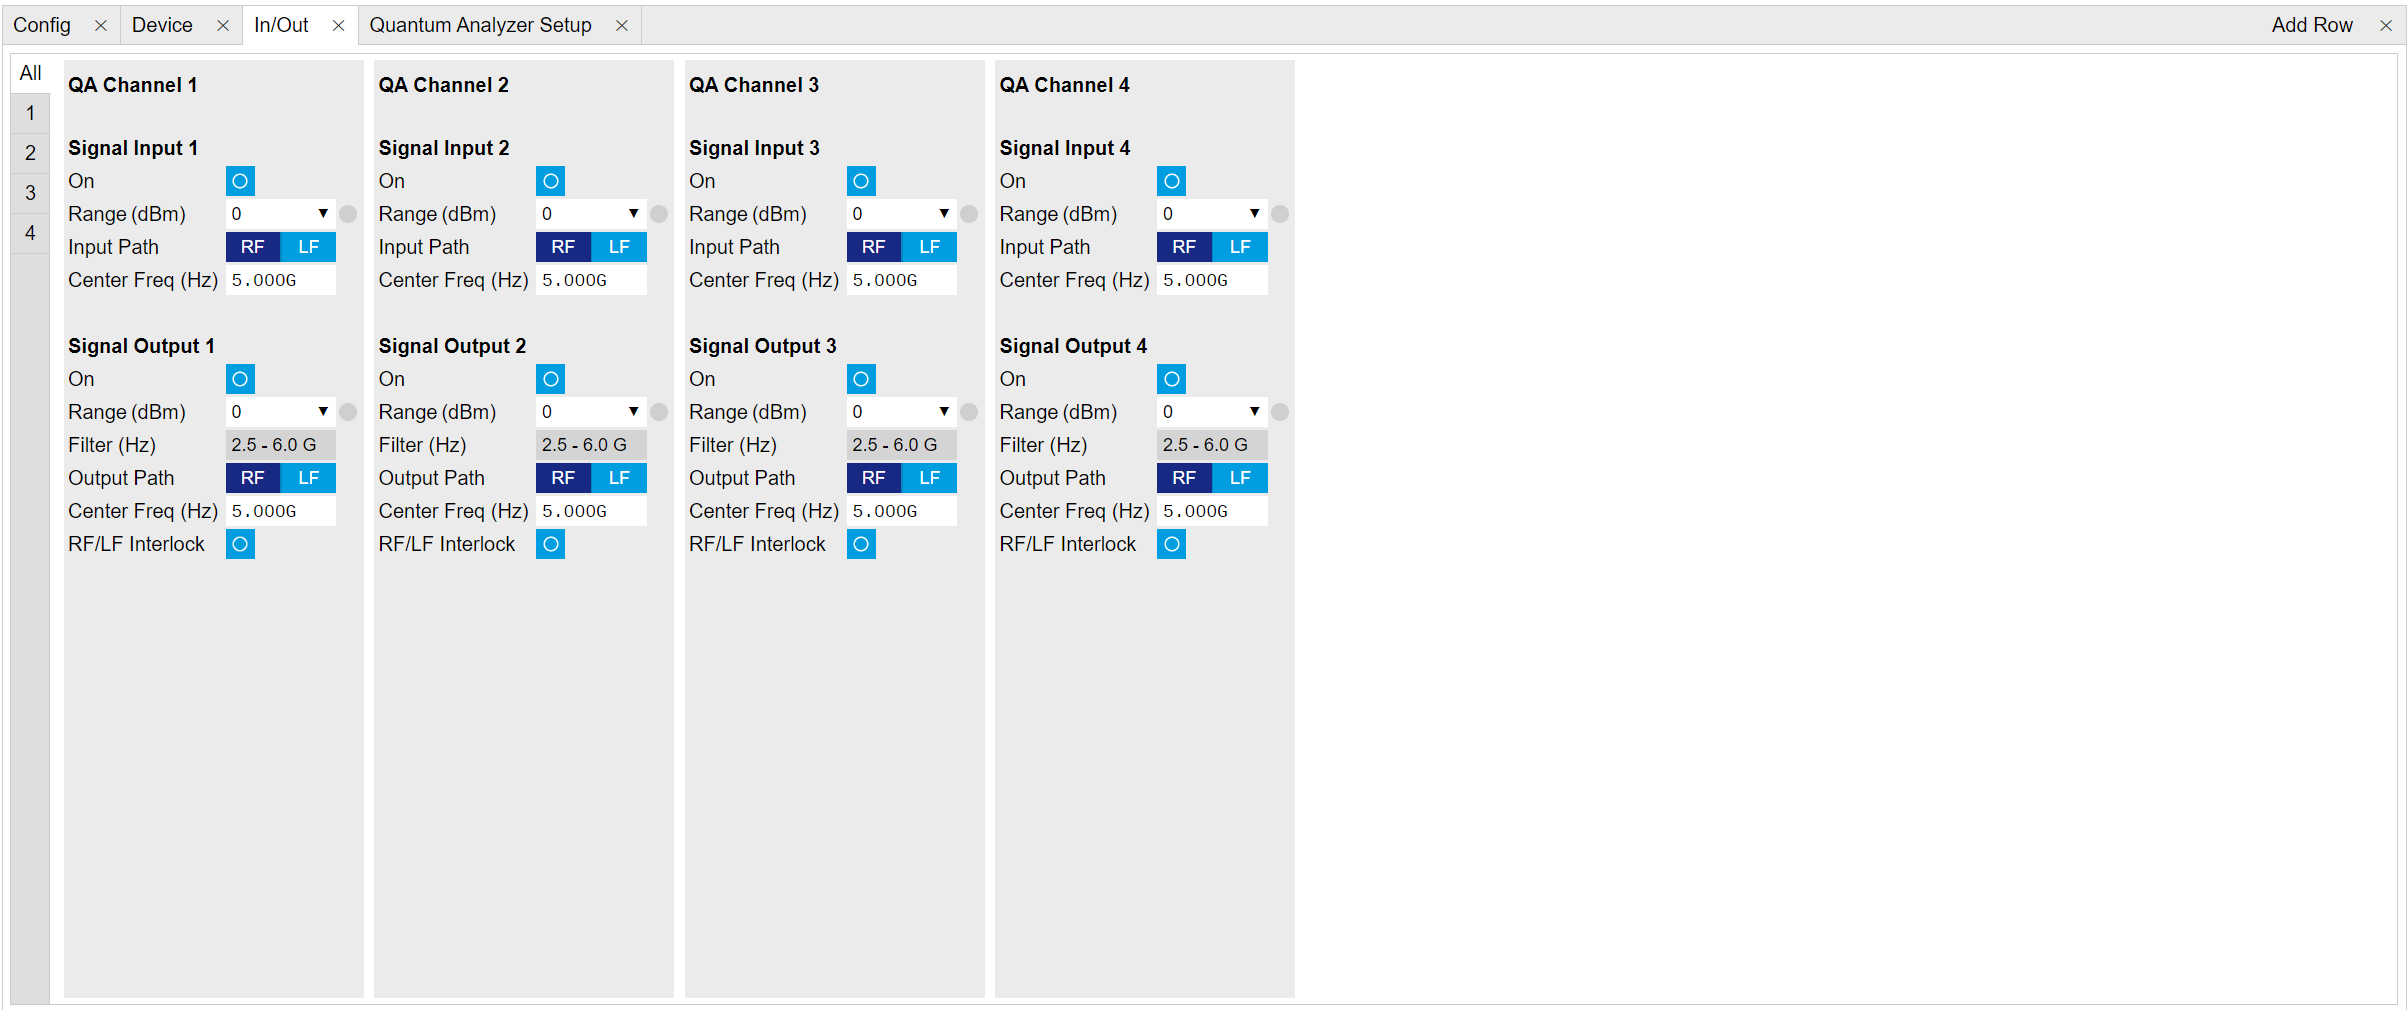
The In / Out tab gives access to the physical configuration of the signal inputs and outputs of the Instrument. The settings are listed in Table 2.
| Control/Tool | Option/Range | Description |
|---|---|---|
| In/Out | Gives access to all controls relevant for the Signal Inputs and Signal Outputs of each channel. |
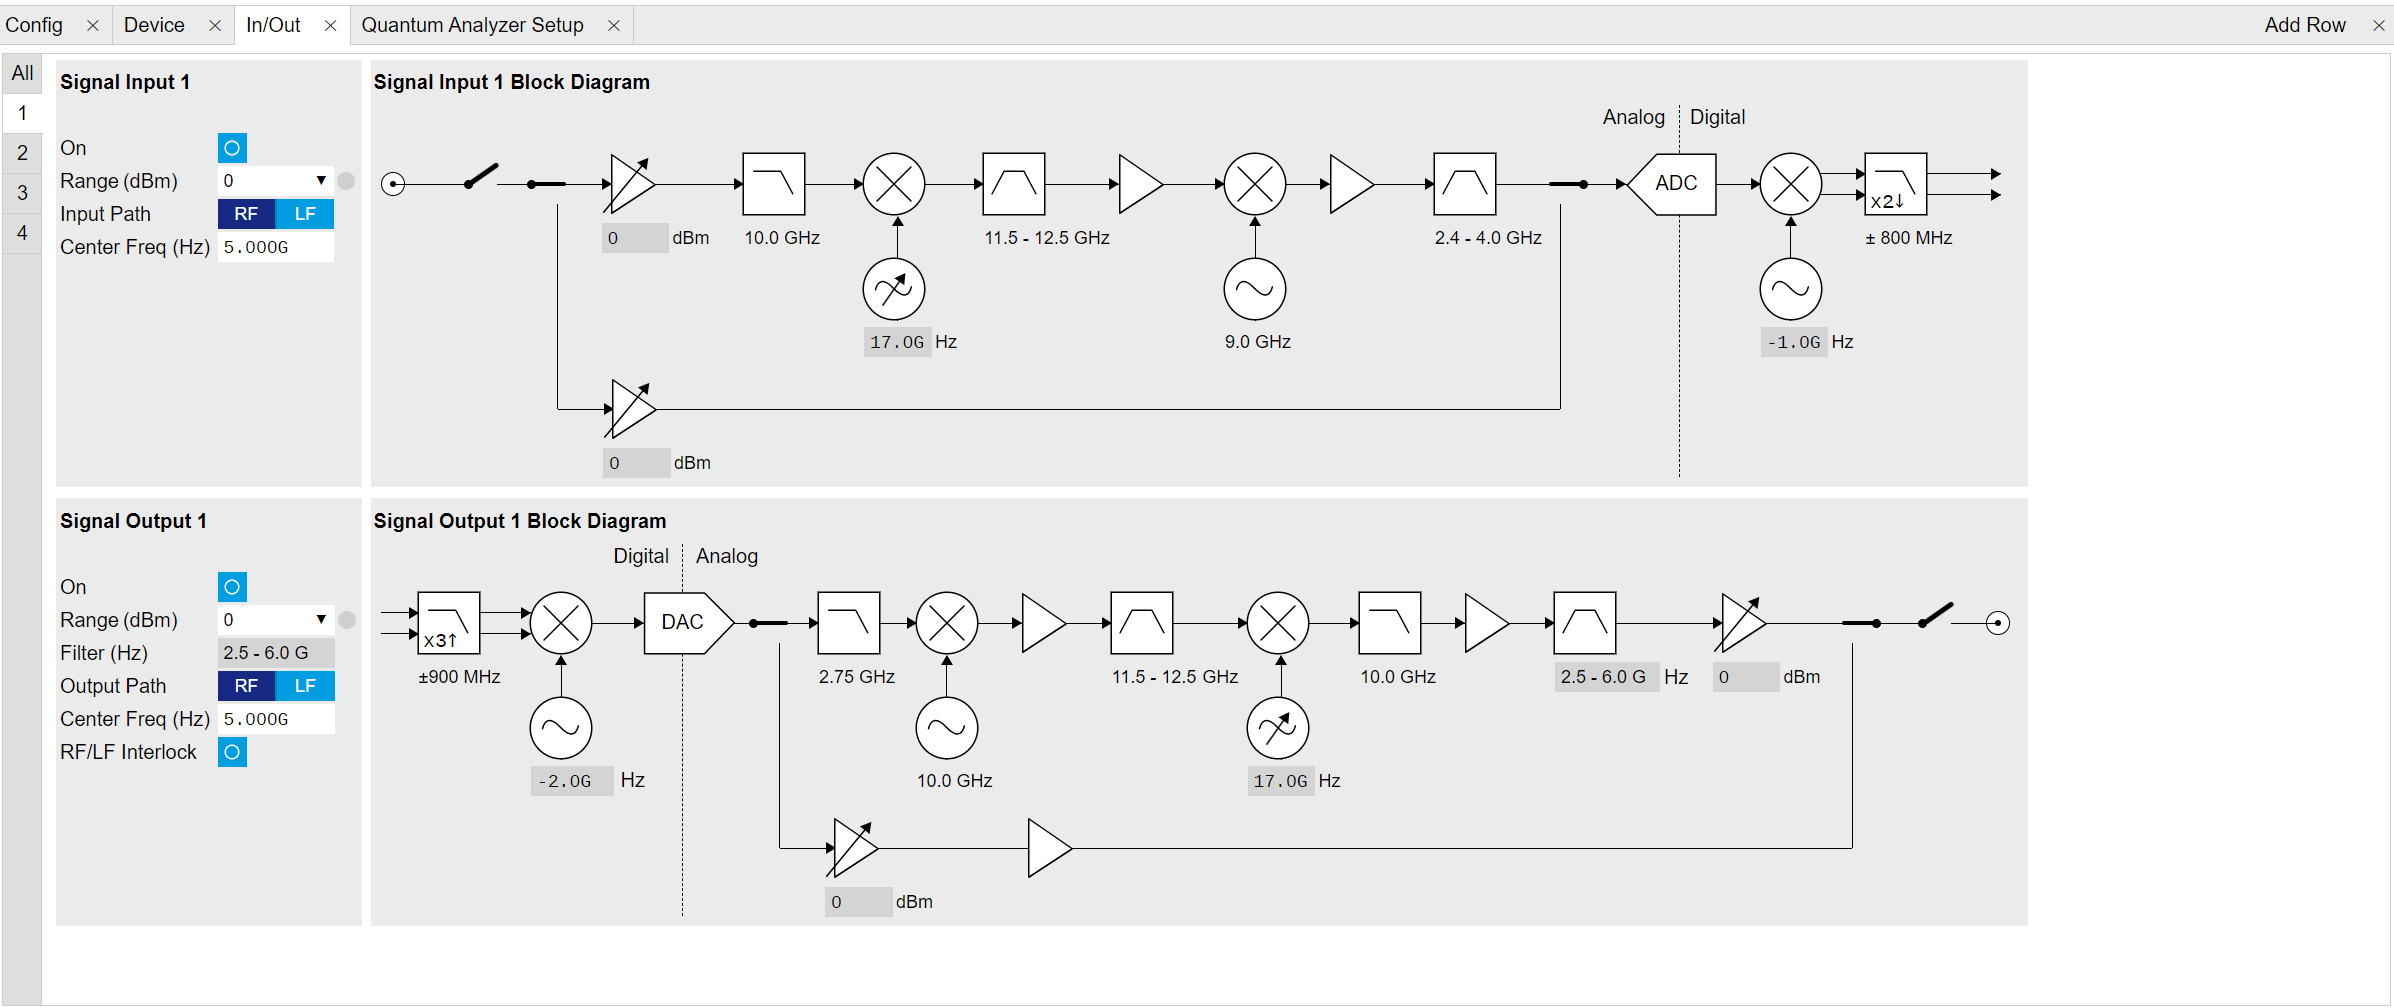
The In / Out tab contains 1 sub-tab for configurations of all channels, and 2 (SHFQA2) or 4 (SHFQA4) sub-tabs for configuration of each channel, as well as the block diagram (see in Figure 1 and Figure 2).
SHFQA+ has 2 selectable signal paths for different frequency range, RF path and LF path, see in Figure 2. The block diagram of RF path with frequency range from 0.5 - 8.5 GHz, and the frequency up and down conversion technique is detailed in the section below. The LF path with frequency range from DC - 800 MHz is available with LabOne APIs. If LF path is enabled for both Input and Output, the frequency of the oscillator before the DAC is set to 0 Hz, then the signal after the DAC is sent out through the output "LF Path", and the input signal through the input "LF path" is converted by the ADC and then mixes with the oscillator at 0 Hz before integration.
Note
It is highly recommended to enable all required inputs and outputs and wait for 2 hours after powering on the instrument.
Note
Please wait for at least 0.5 seconds after switching the center frequency or
power range before running a measurement.
Alternatively, check the status of the node
/dev.../qachannels/n/busy to be back at zero after a change.
Note
Please do not change the center frequency or input range while acquiring data. Mishandling of this could lead to an invalid scaling of the result vector.
Double Superheterodyne Frequency Up/Down-Conversion (RF path)
The SHFQA+ uses double superheterodyne frequency conversion to convert its digital 1-GHz-wide analysis band in an analog stage from baseband frequencies to microwave frequencies up to 8.5 GHz. Each readout channel has its own frequency up/down-conversion chain and its own synthesizer to generate microwave frequencies.
For the Signal Output, the digital 1-GHz-wide analysis band centered around DC is first interpolated by a factor of 3, then digitally up-converted to 2 GHz (light blue elements) before it is passed to the 14-bit DAC. Then, the analog signal (dark blue elements) is mixed to 12 GHz by means of a local oscillator at 10 GHz. To remove all unwanted spurious signals, the signal is strongly filtered before it is down-converted in a second mixing process with a variable local oscillator. Depending on its software-controllable frequency value, the final output frequency band has a center frequency between 1-8 GHz and a width of ±0.5 GHz. Several amplifiers, attenuators and filters in the up-conversion chain ensure that the different elements are not saturated and that the ADC range is faithfully mapped to the selected Output Range.

The Signal Input down-conversion chain (dark blue elements) works analogously, but in the backwards direction. The main differences to the Signal Output are the missing selectable filter and the conversion to 3 GHz instead of 2 GHz before the digitization through the 14-bit ADC. Because of the sampling rate of 2 GSa/s, the 3 GHz signal appears as a 1-GHz signal in the digital domain (light blue elements) before being down-converted to DC.

The advantages of this scheme, for example compared to IQ-mixer based frequency conversion, are that it is calibration-free, wide-band and robust. The optimal selection of the different gains, attenuations and filters in the frequency conversion chains are taken over by the SHFQA+, such that only a few settings need to be set to control the Input and Output Signal band parameters of the SHFQA+: Center Frequency, Input/Output Ranges, and Input/Output Enabled.
Frequency Representation
The frequency \(f_{\mathrm{out}}\) of the output signal on each channel can be calculated as
where \(f_0\) is the center frequency (Center Freq (Hz)), \(f_{\mathrm{offset}}\) is the offset frequency (Offset Freq (Hz)) set by either a Digital Oscillator, or an uploaded waveform (see in Quantum Analyzer Setup Tab). The range of \(f_0\) is listed in Table 2. The range of \(f_{\mathrm{offset}}\) is from -1 GHz to 1 GHz. Please note that signals with an absolute offset frequency greater than 500 MHz will be attenuated significantly.
The frequency \(f_{\mathrm{in}}\) of the input signal on each channel can be calculated as
where \(f_{\mathrm{IF}}\) is the intermediate frequency (IF) after frequency down-conversion. The down-converted signal can be monitored by the SHFQA+ Scope. In resonator spectroscopy experiments, the signal with \(f_{\mathrm{IF}}\) is integrated by the same Digital Oscillator. In qubit readout experiments, it is integrated by an uploaded waveform.
Power Representation
The power \(P_{\mathrm{out}}\) of the output signal on each channel is calculated as
where \(P_{\mathrm{range,\ out}}\) is the output power range in units of dBm, \(g_{\mathrm{osc}}\) (\(g_{\mathrm{osc}} \le 1\)) is the amplitude gain of the Digital Oscillator, \(A\) (\(k\le1\)) is the amplitude of an uploaded waveform. Please note that the 14-bit vertical resolution of the output signal counts both waveform amplitude and oscillator amplitude gain in Spectroscopy mode. To have full 14-bit vertical resolution on the uploaded waveform, the amplitude gain of the oscillator has to be 1.
The input signal can be monitored by the SHFQA+ Scope. The power \(P_{\mathrm{in}}\) of the input signal can be calculated as
where \(A_{\mathrm{IF,\ I}}\) (\(A_{\mathrm{IF,\ Q}}\)) is the amplitude of IF I (Q) components displayed on the SHFQA+ Scope in units of RMS voltage Vrms (V) in RF (LF) path. The \(P_{\mathrm{in}}\) is calculated in units of dBm.
Fast output muting
Note
Fast output muting is available only on the SHFQA+, not on the SHFQA. See Differences between SHFQA and SHFQA+
The SHFQA+ can dynamically mute the RF output in order to reduce the noise injected into the system under test when no signal is applied.
If the muting functionality is enabled, the marker output is connected to the attenuation elements that implement the ranging (see Figure 3). When the marker value is high, the range is lowered by 20 dB from the previously set value, and when it's low it's unchanged. The transition is fast and happens in few tens of nanoseconds, so it can be used in real-time sequences.
The marker output is functional even when muting is enabled. The signal is the same as the muting control and can't be changed.
Muting works only when the range is equal or higher than -10 dBm; if the range is lower, muting will have no effect, since the 20 dB attenuation used for muting is already enabled.
The muting functionality is offered by LabOneQ with the automute Calibration Option. When this option is active, LabOneQ will automatically turn on and off the mute depending on the signal generated.
Functional Elements
The following Table 2 summarizes all settings. The modes are all accessible through the SHFQA+ nodes in Device Node Tree.
| Control/Tool | Option/Range | Description |
|---|---|---|
| Signal Input | ||
| Input On | On/Off | Enables the Signal Input. |
| Input Range | RF: -50 dBm to +10 dBm LF: -30 dBm to +10 dBm |
Sets the maximal input power range that maps to the full scale of the ADC. The Ranges decrease in steps of 5 dB from +10 dBm. |
| Input Overload Status | grey/yellow/red | Indicates whether input power on the front panel \(P_{\mathrm{in}}\) is or was above input power range \(P_{\mathrm{in, \ range}}\) . red: \(P_{\mathrm{in}}\) is > \(P_{\mathrm{in, \ range}}\) yellow: \(P_{\mathrm{in}}\) was > \(P_{\mathrm{in, \ range}}\) within the last 200 ms grey: \(P_{\mathrm{in}}\) is ≤ \(P_{\mathrm{in, \ range}}\) Note that Input Overload condition may damage the Instrument. Please avoid it by increasing Input Range or attenuating input signal. |
| Input Path | RF or LF path | Select RF (0.5 - 8.5 GHz) or LF (DC - 800 MHz) input path. |
| Center Frequency | RF: 1-8 GHz LF: 0 Hz |
Sets the center frequency of the analysis band in Hz. The frequency is rounded to the nearest multiple of 200 MHz. It is common to both the Input and Output of the same readout channel. |
| Signal Output | ||
| Output On | On/Off | Enables the Signal Output. |
| Output Range | RF: -30 dBm to +10 dBm LF: -30 dBm to +5 dBm |
Sets the maximal output power range that maps from the full scale of the DAC. The Ranges decrease in steps of 5 dB from +10 dBm (RF) or +5 dBm (LF). |
| Output Overload Status | grey/yellow/red | Indicates whether output amplitude scaling factor \(g_{\mathrm{DAC}}\) before DAC is or was above 1. It is checked for an overload condition every 10 ms. red: \(g_{\mathrm{DAC}}\) is > 1 yellow: \(g_{\mathrm{DAC}}\) was > 1 within the last 200 ms grey: \(g_{\mathrm{DAC}}\) is ≤ 1 Note that overshot of square pulse could cause Output Overload, and using e.g. flat-top Gaussian could avoid this. |
| Output Filter | Center frequency in RF path: Filter frequency 0.6 - 1.2 GHz: 0.1 - 1.5 GHz 1.4 - 3.0 GHz: 0.1 - 3.5 GHz 3.2 - 5.4 GHz: 2.5 - 6.0 GHz 5.6 - 8.0 GHz: 5.0 - 10.0 GHz |
Indicates selected filter in the RF path. The filter value is selected according to the center frequency value and ensures that higher signal harmonics are removed at the Signal Output |
| Output Path | RF or LF path | Select RF (0.5 - 8.5 GHz) or LF (DC - 800 MHz) output path. |
| Center Frequency | RF: 1 - 8 GHz LF: 0 Hz |
Sets the center frequency of the analysis band in Hz. The frequency is rounded to the nearest multiple of 200 MHz. It is common to both the Input and Output of the same readout channel. |
| RF/LF Interlock | On/Off | Enables the RF/LF path interlock between input and output. If enabled (1), the output path is always configured according to the input. The default value is disabled (0). |