Impedance Analyzer Tab
The Impedance Analyzer tab is available on MFIA Impedance Analyzer instruments and on MFLI Lock-in Amplifier instruments with installed MF-IA Impedance Analyzer option (see Information section in the Device tab).
Features
- Control for impedance analyzer unit (2 units with MF-MD option)
- Auto ranging and auto bandwidth
- Current Zone ranging with customizable range switching frequencies
- Graphical display of measurement mode: 2- and 4-terminal configuration
- Graphical display of DUT representation: Rp||Cp, Rs+Cs, Ls+Rs, C, D,...
- 0.05 % basic accuracy
- 1 mΩ to 1 TΩ measurement range
- 20 ms measurement speed for basic accuracy
- Compensation Advisor for a variety of compensation procedures
- Confidence Indicator
- Independent current and voltage measurement
- One-period averaging for low frequency impedance measurements
Description
The Impedance Analyzer tab is the main control panel for impedance measurements. On MFIA Impedance Analyzer instruments, the tab is open by default. Whenever the tab is closed or an additional one of the same type is needed, clicking the following icon will open a new instance of the tab.
| Control/Tool | Option/Range | Description |
|---|---|---|
| IA | Quick overview and access to all the settings and properties for impedance measurements. |
The Impedance Analyzer tab consists of one side tab for each impedance analyzer unit, and the Cal side tab giving access to the Compensation Advisor. The numbered side-tab(s) for the impedance analyzer units (see Figure 1) are the main measurement interface. The main settings are accessible in the Measurement Control section on the left. The Equivalent Circuit section holds the controls for configuring the circuit representation visualized by a graphical circuit diagram. With the Mode setting, the user selects between a 2- and a 4-terminal setup which has to correspond to the physical wiring of the device-under-test (DUT). The Representation setting allows the user to convert the measured impedance Z into a parameter pair of a DUT circuit representation, such as parallel resistance and capacitance (Rp || Cp), or serial resistance and inductance (Rs + Ls). The data are displayed in the Measurement Results section on the right. The equivalent circuit parameters appear as Representation Parameter 1 and 2 elsewhere in Measurement the UI, e.g. in the Numeric Tab or the Plotter Tab tab. The Enable button at the top left initiates the measurement by turning on the drive voltage and starting the current and voltage measurement.

The Measurement Control section of the tab contains settings related to measurement range, frequency, and output drive amplitude. By default, all of those parameters are under automatic control of the Impedance Analyzer providing suitable settings for most situations. Manual or Current Zone Range Control is available for some more advanced cases. E.g., disabling automatic Range Control by setting it to Manual or Current Zone can help preventing or forcing range changes in sweeper measurements. In addition, a Manual Bandwidth Control is available to help in conditions with strong noise. The measurement bandwidth should then be chosen as a compromise between speed and precision. In auto bandwidth mode, the instrument selects an appropriate bandwidth for the desired Ω suppression (see Sinc Filtering). Disabling automatic Drive Control allows the user to specify the drive amplitude when measuring an electrically sensitive DUT, for example. The numeric controls for bandwidth and drive amplitude are accessible in the Lock-in Tab.
More advanced controls for signal bandwidth, digital data transfer, and more. become accessible in the lower half of the tab after switching Mode from Application to Advanced in the Measurement Control section, see Figure 2. The Confidence Indicators offer control of a number of features assisting in the measurement. The Indicators provide warning messages in the Sweeper Tab, Plotter Tab, and Numeric Tab tab that prevent misinterpretation of measurement data. The different warning messages are explained in the table below. All Indicators can be individually enabled or disabled, and the numeric settings provide fine-tuning of the error thresholds. The Discard Samples feature allows the user to disregard outlier measurements using thresholds.
For impedance measurements at low frequency, the one-period averaging feature (located in the Measurement Control sub-tab) can be enabled. Once enabled, the one-period averaging feature will automatically be active below a frequency threshold (defined by the data transfer rate), and the standard measurement mode will be used above this threshold. The active state is indicated by a green LED next to the enable switch. One-period averaging uses an alternative method to calculate impedance compared with the standard measurement mode. Current and voltage are measured for one period and subsequently divided to calculate the impedance, this technique suppresses the unwanted omega components by averaging over one full period. This is in contrast to the standard measurement mode of the MFIA, where unwanted omega components are filtered out using a low pass filter. The advantage of one-period averaging is the increased measurement speed for low frequencies, as more relaxed (faster) filter settings can be used.
During one-period averaging, the Demod signals will contain significant omega components and therefore do not return reliable values. If the Demod streams are required, switch off one-period averaging. Both Sweeper Tab and Plotter Tab can be used with one-period averaging to calculate impedance. Please note, during the first period of the measurement, no data is transferred as no valid result is available during this time.

| Confidence Indicator | Warning message | Situation | Corrective action |
|---|---|---|---|
| Suppression | Suppression | The DUT is characterized by strongly differing impedance components. The calculation of the flagged Representation Parameter is unreliable. | Change measurement frequency, select appropriate representation corresponding to the DUT |
| Compensation | Strong Compensation | A measurement is carried out in a parameter range in which the user compensation enforces a large correction, making the measurement unreliable. | Check whether the test fixture is suitable for the measured impedance range and frequency. Check that the chosen compensation method is suitable for the impedance range. Consider including a "load" step with a load close to the measurement range. |
| Open Detect | Open Detected | One of the terminals in a four-terminal is disconnected | Check the correct wiring of the DUT (e.g. 2-terminal DUT in a 4-terminal measurement). Check for broken connections. |
| Underflow Detect | Current Underflow, Voltage Underflow | Voltage or current reading is close to zero | Check for open connections. If connections are correctly closed, check if the selected Range is suitable for the measured impedance when using the Range Modes Manual and Impedance. |
| Overflow Detect | Current Overflow, Voltage Overflow | Voltage or current reading is close to the input range or exceeding it | Check if the selected Range is suitable for the measured impedance when using the Range Modes Manual and Impedance. |
| Frequency Limit | Freq Limit | Measurement frequency is higher than the bandwidth of the selected current input range | Select a larger current range in the range control settings or set Range Control to Auto. |
| Negative Q/D | Negative Q/D | The measured Q or D factor, or any measurement contributing to the displayed average, is negative | Check whether the chosen Representation corresponds well to the connected DUT, evaluate the quality of the applied compensation, and check for presence of strong noise. A negative Q or D factor mean the measured impedance can not be physically mapped to the chosen Representation. |
| Z too low for 2-terminal | Low DUT 2T | The measured Z is lower than the defined threshold for 2-terminal measurements | For low impedance measurements, 4-terminal measurements are recommended. The threshold for this confidence indicator can be manually adjusted or disabled in the advance section of the Impedance Tab |
| Different representation | Different representation | This flag highlights traces within the displayed data set which were acquired using an equivalent circuit representation other than the last set representation | Remove these traces from the recorded data using the history tab, or restart the data with the required representation |
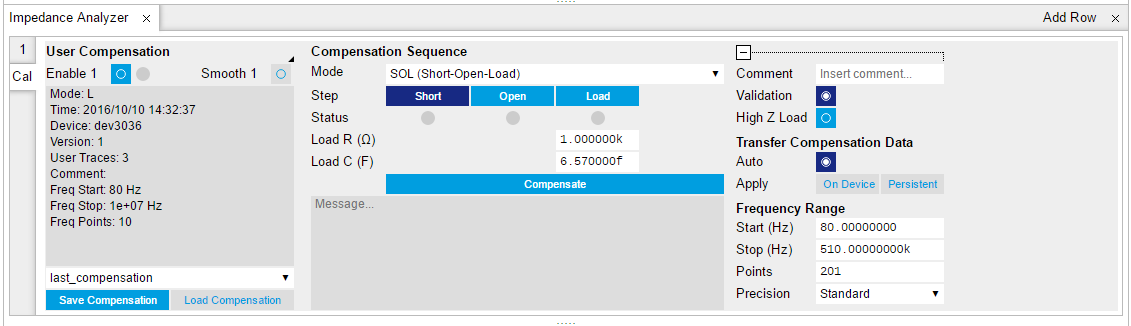
Compensation
The Cal side-tab (see Figure 3) provides user guidance through a compensation procedure. Compensation reduces the effect of test fixture parasitics and thus improves measurement accuracy. It requires a measurement of one or more reference devices under test (DUTs) with precisely known impedance values in a certain frequency range. The available compensation methods are combinations of measurements of short ("S", DUT with zero impedance) and load ("L", DUT with known impedance of arbitrary value). An Open ("O", DUT with infinite impedance) step is not recommended, but if necessary can still be found in the Advanced tab. Please have a look at the Signal Processing chapter of the MFIA Impedance Analyzer user manual to learn more about the background and practicalities of the compensation, and at the Tutorial section in this document for step-by-step instructions for a specific example. The MFIA User Manual is available on the Zurich Instruments website. To prepare a compensation, select the appropriate Mode, connect the reference DUT and click on Compensate.
Functional Elements
| Control/Tool | Option/Range | Description |
|---|---|---|
| Enable | ON / OFF | Enable impedance calculation for demodulator data. |
| One-Period Averaging | ON / OFF | Enables one-period averaging for low frequency impedance measurements. |
| One-Period Averaging | grey/green | The LED is green when one-period averaging is active. |
| Lower Frequency Limit (Hz) | Lower frequency limit where the current input range will be enabled. | |
| Upper Frequency Limit (Hz) | Upper frequency limit where the current input range will be enabled. | |
| Cable Length | One way length of RG58 cables used in measurement set up. This setting corrects for the phase shift introduced by an ideal cable. | |
| Representation | Representation of the complex impedance value Z by two real values accessible as Parameter 1 and Parameter 2 on all user interface displays. | |
| Rp \|\| Cp | Impedance value Z is represented by a resistive element Rp in parallel with a capacitive element Cp. | |
| Rs + Cs | Impedance value Z is represented by a resistive element Rs in series with a capacitive element Cs. | |
| Rs + Ls | Impedance value Z is represented by a resistive element Rs in series with a inductive element Ls. | |
| G B | Impedance value Z is represented by conductance G = Real(Y) and Susceptance B = Imag(Y) of the admittance Y = 1/Z. | |
| D Cs | Impedance value Z is represented by a dissipation factor D = -Real(Z)/Imag(Z) (loss tangent) and a capacitive element. | |
| Q Cs | Impedance value Z is represented by a quality factor Q = -Imag(Z)/Real(Z) and a capacitive element. | |
| D Ls | Impedance value Z is represented by a dissipation factor D = Real(Z)/Imag(Z) (loss tangent) and an inductive element. | |
| Q Ls | Impedance value Z is represented by a quality factor Q = Imag(Z)/Real(Z) and an inductive element. | |
| Rp \|\| Lp | Impedance value Z is represented by a resistive element Rp in parallel with a inductive element Lp. | |
| D Cp | Impedance value Z is represented by a dissipation factor D = -Real(Z)/Imag(Z) (loss tangent) and a capacitive element. | |
| εᵣ' \|\| εᵣ'' | The relative dielectric constant εᵣ is represented by the real part εᵣ' and the frequency-normalized imaginary part εᵣ'' (εᵣ = εᵣ' - j ω εᵣ''). | |
| Real(Z) | Real part of the measured impedance Z. | |
| Imag(Z) | Imaginary part of the measured impedance Z. | |
| Abs(Z) | Absolute value of the measured impedance Z. | |
| Phase(Z) | Phase of the measured impedance Z. | |
| Frequency | Frequency at which the current impedance is measured. | |
| Parameter 1 | Currently active representation parameter 1 and the corresponding measured value. A representation is based on the measured impedance and the frequency. Representations are only valid within a specific frequency or impedance region. | |
| Parameter 2 | Currently active representation parameter 2 and the corresponding measured value. A representation is based on the measured impedance and the frequency. Representations are only valid within a specific frequency or impedance region. | |
| Thickness | Fill in the thickness of the material-under-test in mm. | |
| Area | Fill in the area of the material-under-test in cm². | |
| MUT | Representation of the relative dielectric properties of the material-under-test by the real and imaginary components. | |
| Osc Frequency | 0 to 5 MHz | Frequency control for the oscillator used for impedance measurement. |
| Range Control | Select input range control mode. | |
| Manual | In manual mode the current and voltage input ranges are adjusted manually and separately. Use this mode with care as overload will result in inaccurate impedance results. | |
| Auto | Dynamically adjust the input range according to the measured input signal strength. This optimizes the dynamic range and precision of impedance measurements. | |
| Current Zone | This ranging option allows you to manually set the switching frequency limits for all eight current input ranges. | |
| Range Control Override | ON / OFF | Indicates disabled periodic auto range control. A running sweeper module takes over the range control and thus disables the periodic range checks. |
| Current Range | 100 nA, 1 µA, 10 µA, 100 µA, 1 mA, 10 mA | Input current range used for the impedance measurement. Small current input range have a reduced bandwidth. In the Range Control modes "Auto" and "Impedance", the current range is switched automatically to a higher range if the frequency is too high. |
| Voltage Range | 10 mV, 30 mV, 100 mV, 300 mV, 1 V, 3.0 V | Input voltage range used for the impedance measurement. |
| Drive Control | ON / OFF | If enabled, the drive voltage amplitude is controlled by the device. If disabled it can be set manually. |
| Test Signal (V) | numeric value | Drive amplitude on the Signal Output. |
| Bandwidth Control | ON / OFF | Enable automatic bandwidth control. If enabled the optimum bandwidth is calculated based on the frequency and measurement data. |
| Max Bandwidth (Hz) | positive numeric value | Limit of the maximum bandwidth used on the demodulator filter. Values above 1 kHz can heavily diminish measurement accuracy in the high-frequency region where the amplitude is no more constant over frequency. |
| ω Suppression (dB) | positive numeric value | Suppression of the omega and 2-omega components. Small omega suppression can diminish measurements of very low or high impedance because the DC component can become dominant. Large omega suppression will have a significant impact on sweep time especially for low filter orders. |
| Suppression Ratio | 1 to 10000 | Error amplification limit for which a secondary parameter is marked unreliable. Larger gain values mean larger warning tolerances. A gain value between 10 and 100 is best. |
| Conf. Indicators | ON / OFF | Enables/disables all confidence indicators to check the reliability of the measured data. To enable individual indicators, open the advanced tab. |
| Suppression Enable | ON / OFF | The Suppression Confidence Indicator indicates if one of the two parameters of a circuit representation cannot be calculated reliably from the measured impedance. This is the case if a small variation in one (dominant) representation parameter creates a strong variation of the other (suppressed) representation parameter. Such an error amplification indicates that the measurement of the secondary parameter is unreliable. |
| Compensation | positive numeric value | Strength of the compensation that will trigger the strong compensation warning. |
| Compensation Enable | ON / OFF | Enables the indication of strong compensation in the plots. A strong compensation diminishes the measurement accuracy of the parameter. |
| Low DUT | positive numeric value | The maximum DUT impedance for which a 2T measurement is marked unreliable. |
| Low DUT Enable | ON / OFF | Enables the detection of small DUTs when doing 2 terminal measurements. Use 4 terminal mode for low impedance measurements. |
| Open Detect | positive numeric value | Open terminal detection ratio. An open terminal is reported if the excitation calculated from current and voltage drop differs more than the specified factor from the driving voltage. |
| Open Detect Enable | ON / OFF | Enables the open terminal detection for 4-terminal measurements. If enabled, an open terminal is indicated in the numeric tab and in plots. |
| Underflow Detect | positive numeric value | The underflow condition is met if the measured amplitude is lower than the specified ratio relative to full scale. |
| Underflow Detect Enable | ON / OFF | Enables the underflow detection for current and voltage. If enabled, an underflow will be shown in the numeric tab and in plots. |
| Overload Detect Enable | ON / OFF | Enables the overload detection for current and voltage. If enabled, an overload will be shown in the numeric tab and in plots. |
| Frequency Limit Enable | ON / OFF | Enables the frequency limit detection based on the used current input range. It is shown in the numeric tab and in plots. Only relevant when Range Control is set to Manual. |
| Negative Q/D Enable | ON / OFF | Enables the detection of negative Q or D factors. Negative Q or D factors mean the measured impedance does not correspond to the chosen Representation. This can be due to an erroneous compensation, a bad choice of the Representation, or noise. A message will be shown in the numeric tab and in plots. |
| Invalid One-period | ON / OFF | Enables the detection of unreliable data points where data sample loss leads to an invalid one-period average. Try reducing the data transfer rate. |
| Control/Tool | Option/Range | Description |
|---|---|---|
| Mode | Switch between application-based or manually configured impedance settings. A parameter set given by an Application mode can be fine-tuned by changing to Advanced mode. Changing back to Application mode will reset the parameters. | |
| Application | The impedance settings are adjusted to fit best the selected application. | |
| Advanced | The impedance settings are manually configured. | |
| Application | Select the Impedance application | |
| LCR Impedance Measurement | General-purpose settings for measuring components at finite frequency | |
| DC Impedance Measurement | Settings for measuring resistance at zero frequency. | |
| Precision | Select the Impedance precision and measurement speed by automatically adjusting the filter bandwidth. If the sweeper module is in impedance application mode the precision setting will also control the sweeper measurement speed. | |
| Low -> fast settling | Medium accuracy/precision is optimized for fast response. | |
| High -> medium settling | High accuracy/precision takes more settling time. | |
| Very high -> slow settling | Very high accuracy/precision uses long settling time due to very low bandwidth. | |
| Show Advanced | ON / OFF | Display the advanced settings. |
| Bias Control (V) | -3 V to 3 V | DC bias voltage applied across the device under test. Both positive and negative bias voltages are supported. In a 4-terminal measurement, the bias voltage is limited by the maximum common voltage input range of the device. In a 2-terminal measurement, the bias voltage can be larger because the voltage inputs are not connected. |
| Bias Control Enable | ON / OFF | Enables bias control. The bias is generated by the additional offset applied on the output. |
| Current Input | Current Input 1 | Select the current input used for two- and four-terminal impedance measurements. |
| Current Invert Enable | ON / OFF | If enabled, the current input signal is inverted. This is useful to switch the polarity of an input signal which can be caused by additional current amplifiers. |
| Scaling factor for current input | numeric value | The value measured at the current input will be scaled by this value. |
| Voltage Input | Voltage Input 1 | Select the voltage input used for a four-terminal impedance measurement. |
| Voltage Invert Enable | ON / OFF | If enabled, the voltage input signal is inverted. |
| Scaling factor for voltage input | numeric value | The value measured at the voltage input will be scaled by this value. |
| AC | ON / OFF | Defines the input coupling for the Signal Inputs. AC coupling inserts a high-pass filter. |
| Current Demodulator | demodulator index | Demodulator used for current demodulation. |
| Voltage Demodulator | demodulator index | Demodulator used for voltage measurement in case of a four-terminal impedance measurement. |
| Output Demodulator | demodulator index | Demodulator unit used to generate the excitation voltage on the Signal Output. |
| Interpolation | Select the interpolation method of the compensation data. The interpolation method is particularly important if the derivative changes strongly e.g at cut-off frequencies. | |
| Linear | The linear interpolation is fastest but may create compensation errors in between the frequency points used for compensation. | |
| Piecewise Cubic Hermite (PCHIP) | The piecewise cubic Hermite interpolation will result in very accurate results but requires more calculation power. | |
| Osc | oscillator index | Oscillator used to generate the frequency of the excitation voltage on the Hcur (+V) connector. |
| Harm | 1 to 1023 | Multiplies the demodulator's reference frequency with the integer factor defined by this field. |
| Order | Select the filter roll-off between 6 dB/oct and 48 dB/oct. High filter orders are beneficial for impedance measurements as they help to suppress DC offsets. | |
| 1 | 1st order filter 6 dB/oct | |
| 2 | 2nd order filter 12 dB/oct | |
| 3 | 3rd order filter 18 dB/oct | |
| 4 | 4th order filter 24 dB/oct | |
| 5 | 5th order filter 30 dB/oct | |
| 6 | 6th order filter 36 dB/oct | |
| 7 | 7th order filter 42 dB/oct | |
| 8 | 8th order filter 48 dB/oct | |
| TC/BW Select | Define the display unit of the low-pass filters: time constant (TC), noise-equivalent power bandwidth (BW NEP), 3 dB bandwidth (BW 3 dB). | |
| TC | Define the low-pass filter characteristic using time constant of the filter. | |
| BW NEP | Define the low-pass filter characteristic using the noise-equivalent power bandwidth of the filter. | |
| BW 3 dB | Define the low-pass filter characteristic using the cut-off frequency of the filter. | |
| TC/BW Value | numeric value | Defines the low-pass filter characteristic in the unit defined above. |
| Sinc | ON / OFF | Enables the sinc filter. |
| Rate | 0.056 Sa/s to 857 kSa/s | Impedance data streaming rate. The same data rate is applied to the demodulators that are used for the impedance measurement. |
| On | ON / OFF | Main switch for the Signal Output corresponding to the blue LED indicator on the instrument front panel. |
| Range | Defines the maximum output voltage that is generated by the corresponding Signal Output. This includes the potential multiple Signal Amplitudes and Offsets summed up. Select the smallest range possible to optimize signal quality. | |
| 10 mV | Selects output range ±10 mV. | |
| 100 mV | Selects output range ±100 mV. | |
| 1 V | Selects output range ±1 V. | |
| 10 V | Selects output range ±10 V. | |
| Enable | ON / OFF | Discarding impedance samples outside the indicated range. |
| Minimum | ON / OFF | Threshold for abs(Z) below which the impedance samples are discarded. |
| Maximum | ON / OFF | Threshold for abs(Z) above which the impedance samples are discarded. |
| Control/Tool | Option/Range | Description |
|---|---|---|
| Compensation Type Select | Displays information on either internal calibration or user compensation. | |
| Internal Calibration | The internal calibration matches all voltage and current ranges over the frequency range in order to achieve a high dynamic impedance range. The internal calibration is performed at Zurich instruments. |
|
| User Compensation | The user compensation will correct for measurement setup influences like capacitive or inductive parasitics. It is applied on top of the internal calibration. | |
| Internal | ON / OFF | Enables the internal calibration. This ensures that the input range gains match over the full frequency range. With enabled internal calibration the device fulfills the impedance accuracy specification. The internal calibration is a prerequisite to apply a user compensation. |
| Active | grey/green | Indicates if the internal calibration is applied to the measurement data. |
| Internal Calibration Info | Display of meta data saved together with the internal impedance calibration data. | |
| User | ON / OFF | Enables the compensation of the impedance data. The user compensation is correcting parasitics and delays caused by the external setup. The user compensation is applied on top of the internal impedance calibration. |
| Active | grey/green | Indicates that a valid compensation is active. If active the impedance data streams deliver amplitude and phase corrected data based on the impedance compensation. |
| User Compensation Info | Display of meta data saved together with the user compensation. | |
| File Name for User Compensation | Enter a new file name to save the current user compensation to a file or select an existing file to load a user compensation. | |
| Save User Compensation | Save the current user compensation to a file. | |
| Load User Compensation | Load a user compensation from a file. | |
| Mode | Select the user compensation sequence. If the sequence involves a short or open condition, it is essential to keep the noise small by using auto range on the voltage and current inputs. | |
| None | No compensation is performed. | |
| SOL (Short-Open-Load) | Compensation of user setup using a short-open-load condition. This compensation method results in very accurate results over the whole impedance range under the condition of low-noise open and short compensation. Thus, this compensation should always be used with enabled auto range. | |
| OL (Open-Load) | The open-load compensation is suited for measuring high impedance. Use auto range to reduce the influence of noise for the open compensation step. | |
| SL (Short-Load) | The short-load compensation is suited for measuring low impedance. | |
| L (Load) | Compensation performed with a single load. This compensation is useful if the measured DUT is close to the load used for compensation. | |
| SO (Short-Open) | The short-open compensation corrects for inductive and capacitive parasitics of the user setup. This compensation method is suited if no load is available for the compensation. It will not correct gain errors. | |
| LLL (Load-Load-Load) | The compensation based on three load values results in very accurate results for a restricted impedance range. Use this method if the noise on the open or short condition is too strong. | |
| Load R | numeric value | Resistance value of the compensation load. |
| Load C | numeric value | Capacitance value of the compensation load. In case of a resistor load the capacitance value is equivalent to its capacitive parasitics. |
| Step | Short, Open, Load | Compensation step to record. The sequence of the steps can be freely selected. Before starting the correct device needs to be connected to the setup. |
| Compensation Step Short | ON / OF | Select to do a short measurement. This compensates for parasitics that are in series with your DUT. |
| Compensation Step Open | ON / OF | Select to do an open measurement. This compensates for parasitics that are in parallel with your DUT. |
| Compensation Step Load | ON / OF | Select to do a load measurement. This compensates for additional gains in your measurement setup. |
| Compensation Step High Load | ON / OF | Select to do a high load measurement. This compensates for additional gains in your measurement setup. |
| Status | grey/green | Indicates a successful compensation step. If the status indicator does not indicate green after a compensation step, check the message box to learn more about the failure. |
| Compensate |  |
Start the compensation measurement for the selected condition. If a compensation measurement is completed successfully, the next pending condition is automatically selected. The message box will contain information on the quality of the completed compensation and failure messages in case of a fail. The progress of the currently active compensation run will be shown in the message box. |
| Message | string | The message pane displays information related to compensation. In case of a failed compensation, information on the root cause is reported. In case of successful compensation, representative parameters are reported to judge the quality of the compensation and measurement setup. |
| Comment | string | User comment that will be saved together with the compensation data. The comment string can also be changed between the different compensation steps. |
| Validation | ON / OFF | Perform a sanity check of the compensation result to detect outlier measurement results, overload, or other error conditions. Validation should only be disabled for compensations performed in special conditions. |
| High Z Load | ON / OFF | Two different loads are measured during user compensation. Improves compensation data. |
| Auto Transfer | ON / OFF | If enabled, a successful compensation will be immediately transferred to the device, activated, and stored permanently. If automatic transfer is disabled, the transfer needs to be initiated manually. |
| To Device |  |
Transfer and activate the recorded compensation manually. |
| Persistent |  |
Store the compensation data persistently on the device. The compensation will be loaded automatically on every power-up. |
| Start (Hz) | 0 to 5 MHz | Lower frequency limit used for calibration. For measurements at lower frequencies than this value, an extrapolation is performed. |
| Stop (Hz) | 0 to 5 MHz | Upper frequency limit used for calibration. This upper limit is essential for correct measurements. |
| Points | positive integer value | Number of frequency points used for compensation. For frequencies between two compensation frequencies the data will be interpolated. |
| Precision | Precision of measurement during compensation. Using high precision can improve the quality of the compensation data in case the measurement is limited by noise. | |
| Standard | Standard filter and averaging settings are applied during compensation measurement | |
| High | Lower filter bandwidth and more averaging are used during compensation measurement |