QCCS Monitor
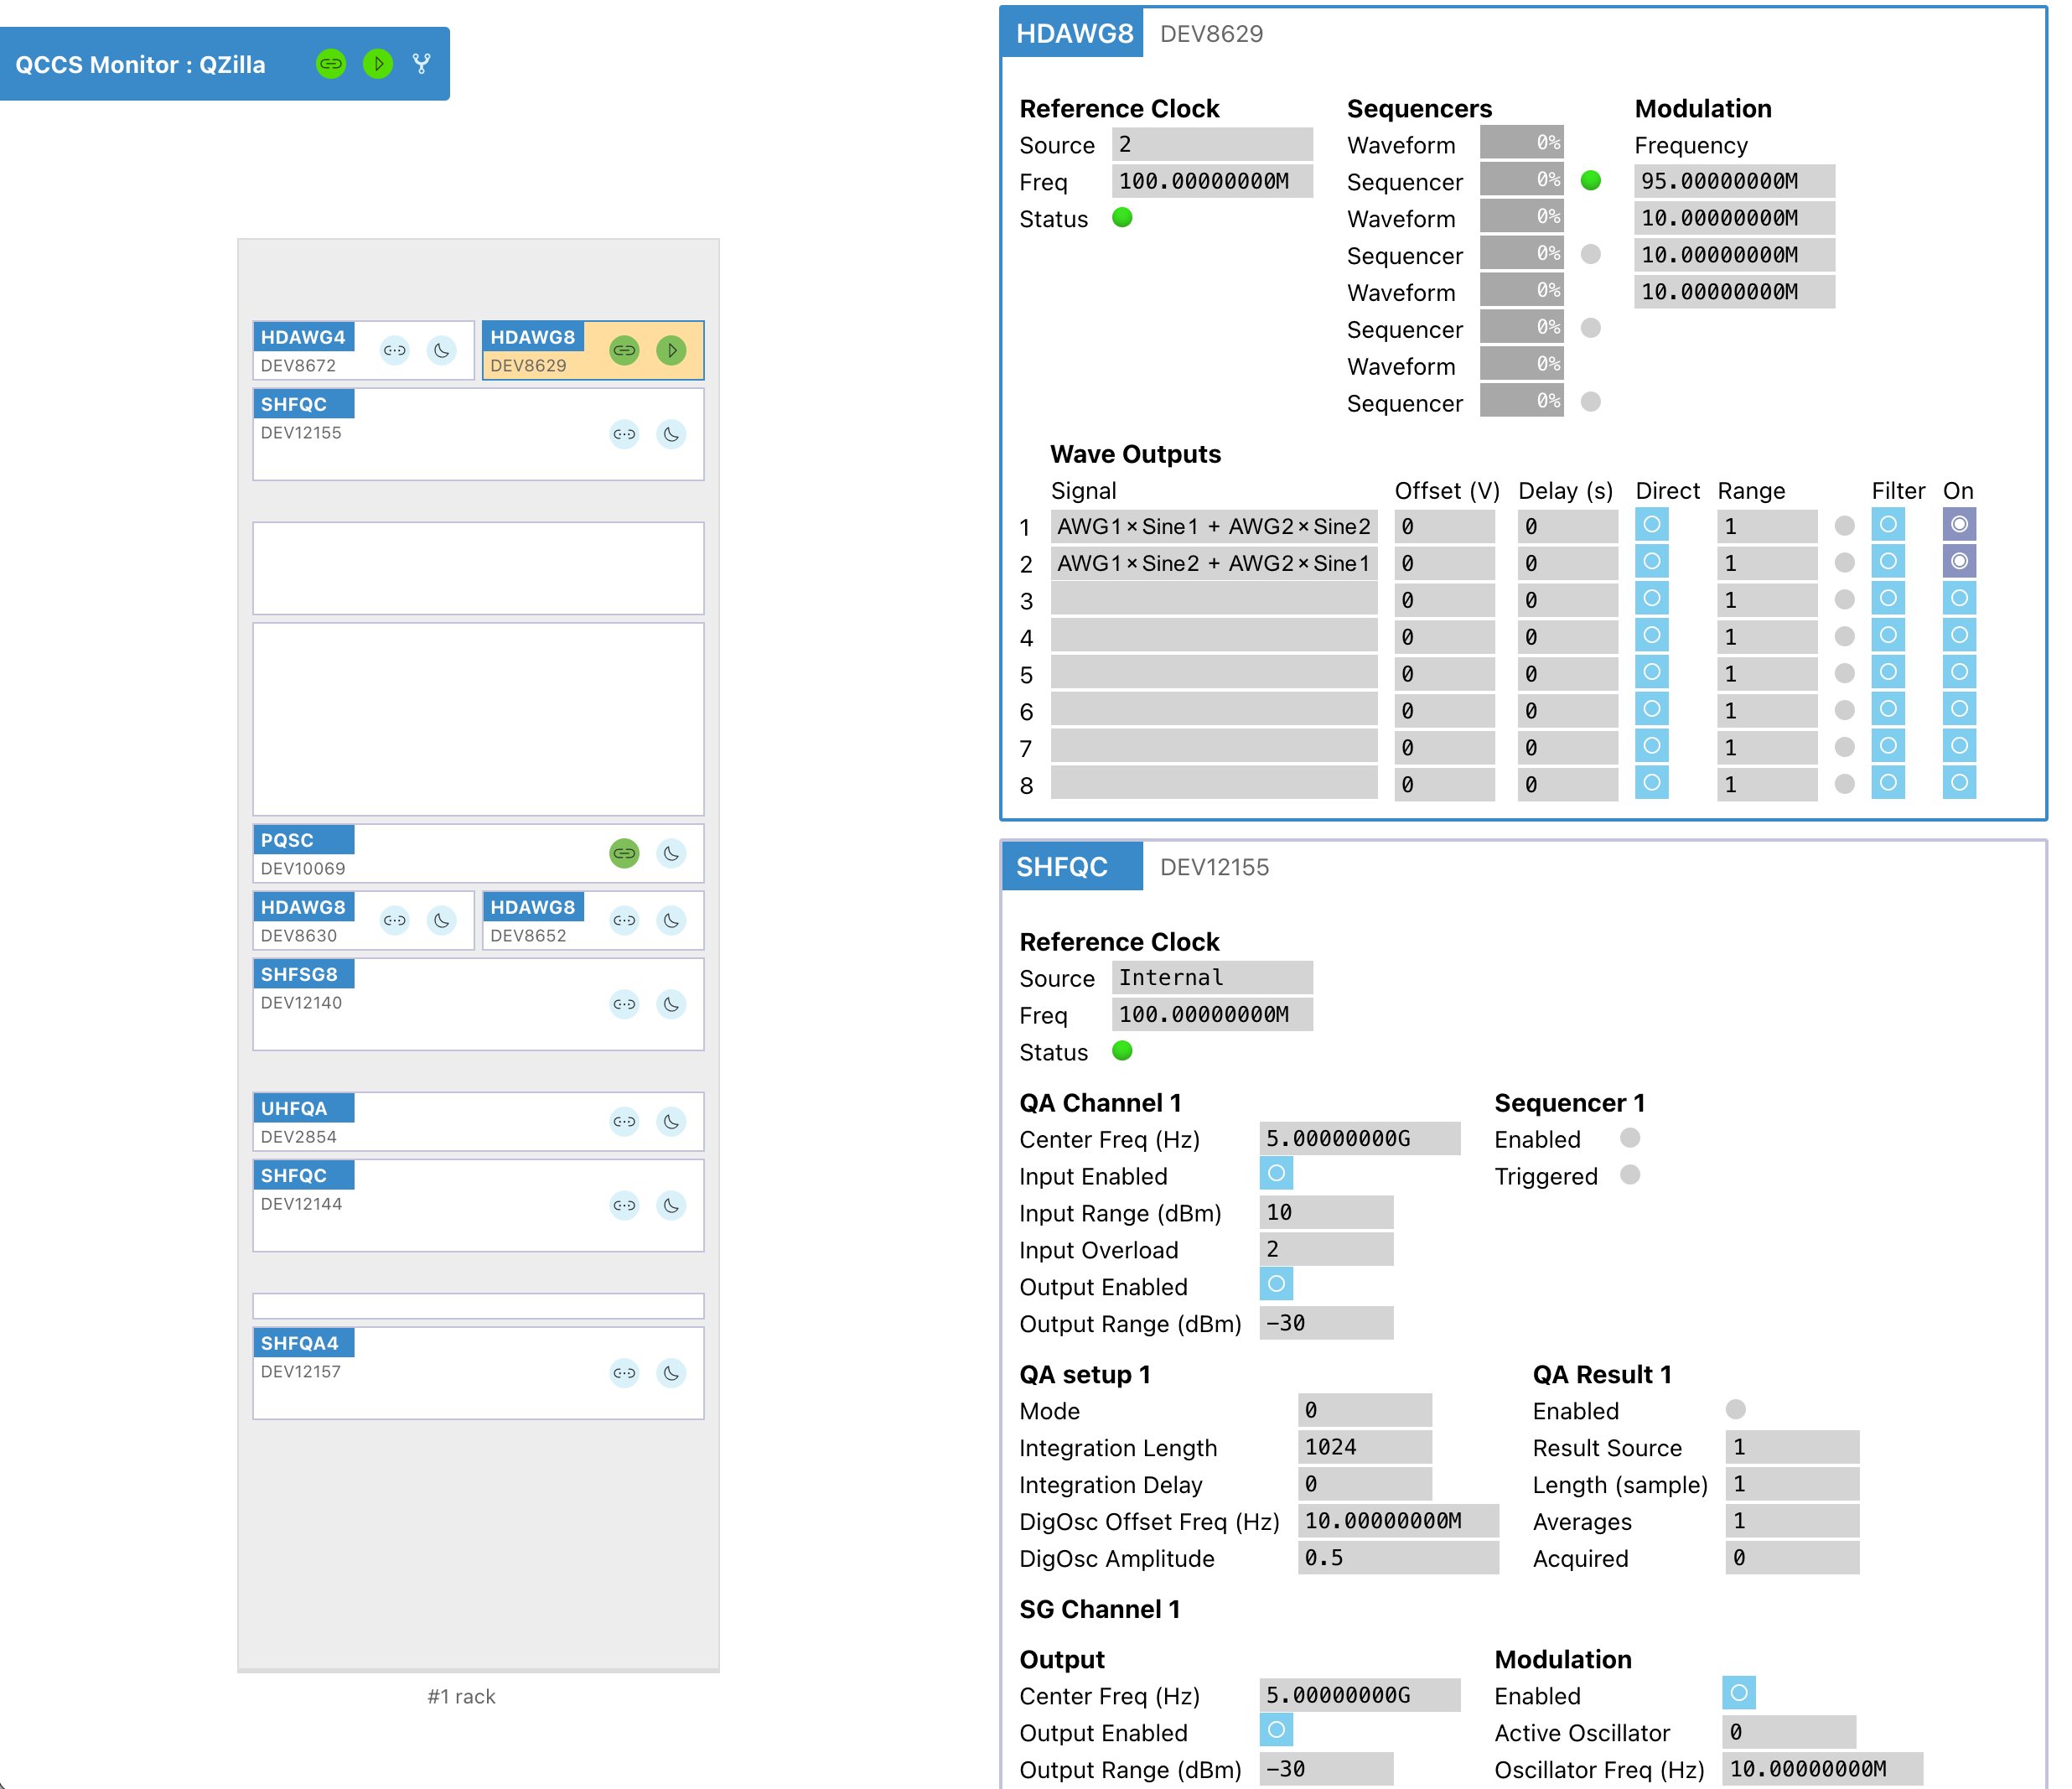
The QCCS Monitor queries the status of a QCCS setup through a LabOne data server and provides an intuitive web interface displaying this status information.
![]()
The QCCS Monitor relies on the monitor server queries the setup status from the LabOne data server and provides a web interface. The monitor server is an executable binary file and is available for Windows, Linux, and macOS operating systems. The web interface can be accessed with any browser.
Read the detailed descriptions of how to set up and use it, or simply head to our YouTube channel for a hands-on demonstration:
Installation and Execution
The QCCS Monitor can be downloaded from the Zurich Instruments Download Center. Download and unzip the file.
The monitor server is started with a simple command line and is configured through the use of JSON files provided as arguments when starting the monitor server.
Run the monitor server with the syntax below (Linux and macOS),
./bin/qccs-monitor-server --resdir=./res -p 9000 ./config/my_setup.json
or, on Windows:
.\bin\qccs-monitor-server.exe --resdir=.\res -p 9000 .\config\my_setup.json
With these settings, the webserver can be accessed at
http://127.0.0.1:9000, if the monitor server and the browser are
running on the same machine. Otherwise, replace 127.0.0.1 with the
domain name or IP address of the host.
You can get an overview of the command line arguments by using --help.
.\bin\qccs-monitor-server.exe --help
You can terminate the monitor server by pressing CTRL+C.
Note
- Make sure the binaries are executable on Linux and macOS.
- Make sure that your firewall is not blocking the used TCP port (see below for troubleshooting in Windows).
Configuration
The configuration JSON file describes the setup’s LabOne data server, the used instruments, and their size in the graphical representation.
Referring to the example below, host and port specify the LabOne
data server the tool will query. The slug is the name of the system.
The elements of rack specify which instruments will be monitored
(devid and devtype) and the layout (height and width) of the
graphical representation.
Currently, the supported device types are: PQSC, HDAWG4, HDAWG8,
UHFQA, SHFQA2, SHFQA4, SHFSG4, SHFSG8, and SHFQC. Use
unknown for every other device type (e.g., 3rd-party
devices) or omit devtype and devid entirely for blanks.
{
  "host": "qccs_data_server",
  "port": 8004,
  "slug": "my_qccs_setup",
  "racks": [[
    { "height": 2, "width": 1, "devtype": "PQSC", "devid": "dev10008" },
    { "height": 2, "width": 0.5, "devtype": "HDAWG8", "devid": "dev8047" },
    { "height": 2, "width": 1, "devtype": "UHFQA", "devid": "dev2119" },
    { "height": 2, "width": 0.5},
    { "height": 3, "width": 1, "devtype": "SHFQA4", "devid": "dev12093" },
    { "height": 3, "width": 1, "devtype": "SHFSG8", "devid": "dev12100" },
    { "height": 3, "width": 1, "devtype": "SHFQC", "devid": "dev12102" },
    { "height": 2, "width": 1, "devtype": "unknown" },
    { "height": 2, "width": 0.5, "devtype": "unknown" },
    { "height": 2, "width": 0.5 },
    { "height": 2, "width": 1, "devtype": "unknown" },
    { "height": 5, "width": 1 }
  ]]
}
Troubleshooting
If you are running the QCCS Monitor under Windows and the webserver is not reachable: This might be related to the Windows firewall settings.
-
Open the Windows Defender Firewall settings
-
Go to the Advanced Settings
-
Find the qccs-monitor-server in the Inbound Rules
-
Right-click → Properties → Advanced
-
Check all boxes: Domain, Private, and Public