Visualization of pulse sequences
The LabOne Q Software gives two possibilities to visualize the expected pulses played on the output signals of the defined experiment: A pulse sheet viewer and a simulation of output signals.
Read the detailed descriptions of both functionalities below, or simply head to our YouTube channel for a hands-on demonstration:
Pulse Sheet Viewer
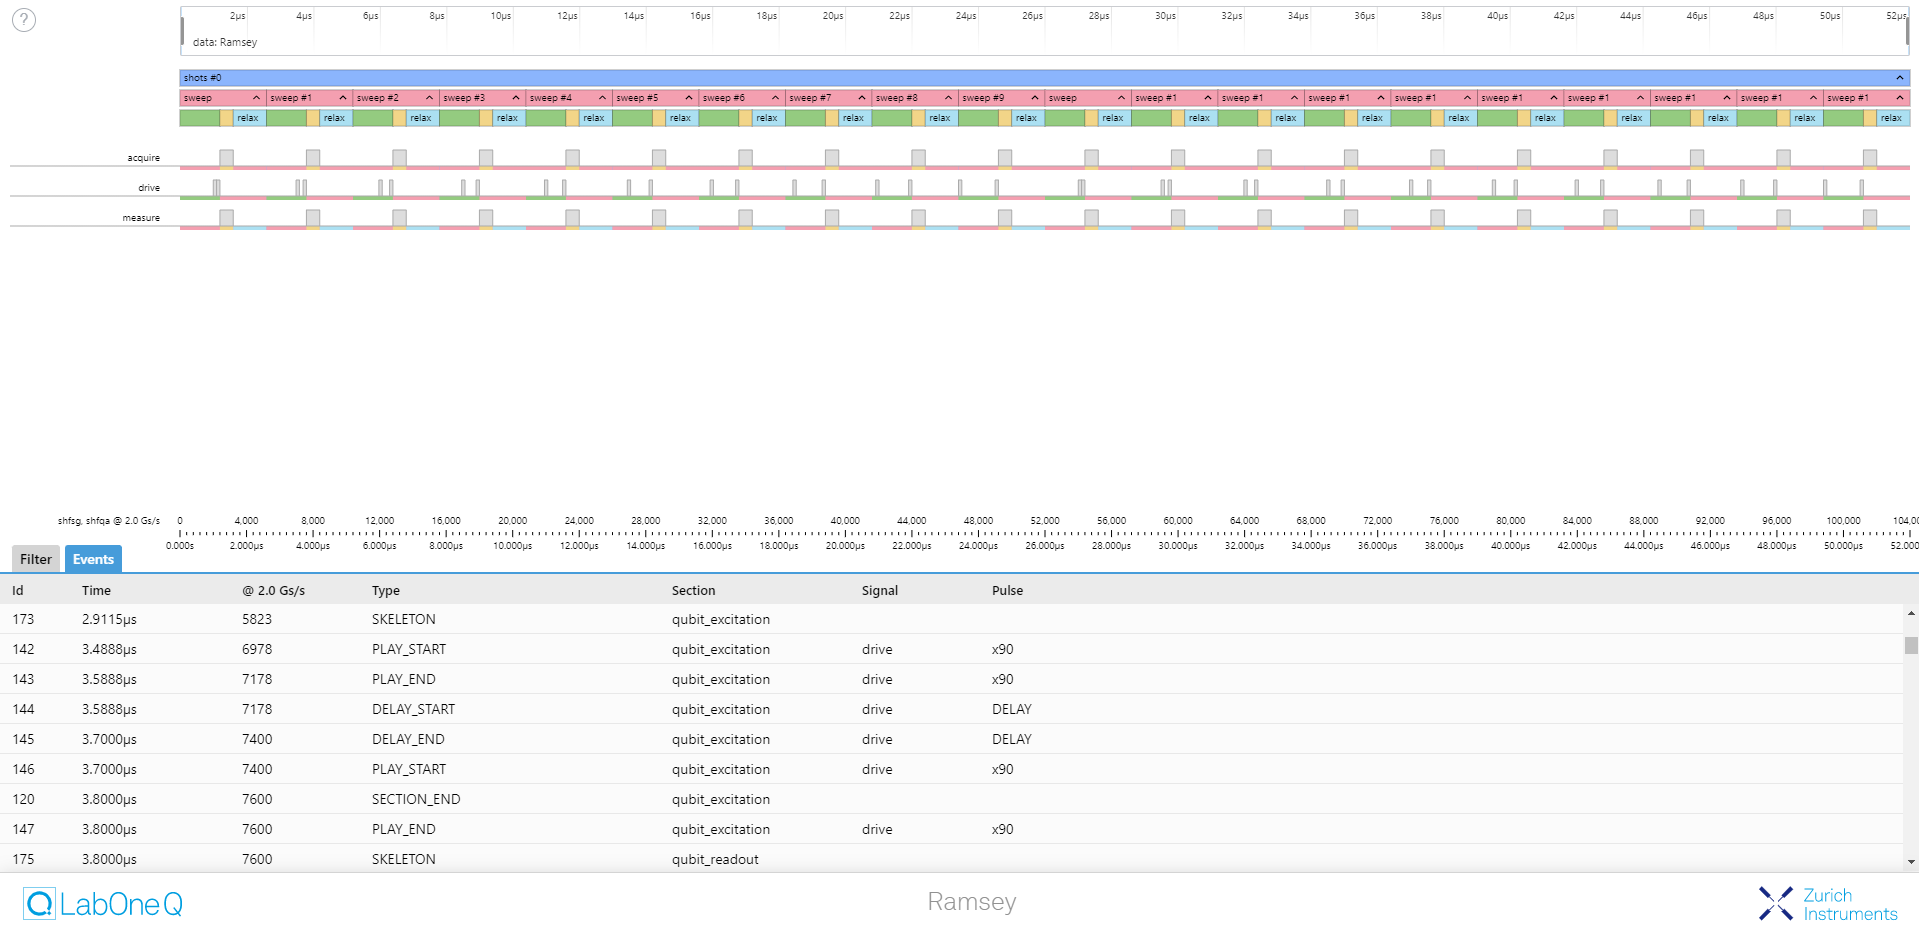
The Pulse Sheet Viewer displays pulses and sections defined in a standalone html file. You can zoom in and out or collapse sections to gain a better overview. The html file also provides a table of all events occurring in the experiment, with timings, given both in absolute and by sample, for all involved instruments.
As the html file is standalone, it can be opened in any browser, archived, or shared with others.
Pulse sheets are created from compiled experiments, and can be created in the emulation mode of LabOne Q, so that pulse sequences can be checked without a hardware connection:
show_pulse_sheet("Ramsey_Experiment", compiled_ramsey_exp)
The tune-up example notebooks located on our GitHub give hands-on examples of how to create pulse sheets.
Note
If your experiment is long (uses many sweep and averaging steps), the Pulse Sheet Viewer can be slow to load. To investigate your experiment, decrease the number of sweep and averaging steps before you create the pulse sheet.
For performance reasons, the maximum number of displayed events is
limited by default to 1000. This limit can be configured through the
MAX_EVENTS_TO_PUBLISH compiler option, as in
session.compile(experiment, compiler_settings={"MAX_EVENTS_TO_PUBLISH": 10000}).
Simulation of Output Signals
While the pulse sheet viewer gives a higher-level overview of the experimental structure, its sections and pulses, LabOne Q is also able to provide a sample-precise simulation of the actual output signals.
The simulation of the output signals can be triggered by using the
compiled experiment with the
laboneq.simulator.output_simulator.OutputSimulator class — this again
can be done in the emulation mode of LabOne Q, so that no connection to
actual hardware is required. The output_simulator example notebook
shows how to simulate and plot the signals.