Multistate discrimination measurements#
Parallel multistate discrimination of multiple qudits.
Note on terminology: in general, we call a d-state entity to be read out “qudit” as opposed to the normal qubit, which only has two states. Furthermore, we refer to 3-state entities as qutrit, and 4-state entities as ququad.
Requirements:
LabOne Version >= 22.08
Instruments: 1 x SHFQA Instrument
Loopback configuration between input and output of channel 0
[1]:
import typing as t
import numpy as np
import matplotlib.pyplot as plt
from zhinst.toolkit import Session, SHFQAChannelMode, Waveforms
from zhinst.utils.shfqa.multistate import QuditSettings

session = Session("localhost")
device = session.connect_device("DEVXXXX")
Configure channel inputs and outputs#
[2]:
CHANNEL_INDEX = 0

device.qachannels[CHANNEL_INDEX].configure_channel(
    center_frequency=5e9,
    input_range=0,
    output_range=-5,
    mode=SHFQAChannelMode.READOUT,
)
device.qachannels[CHANNEL_INDEX].input.on(1)
device.qachannels[CHANNEL_INDEX].output.on(1)
Trigger settings#
[3]:
# trigger the scope using the sequencer
SCOPE_IDX = 0  # there is currently only one scope on the device
SCOPE_TRIGGER_CHANNEL = f"chan{CHANNEL_INDEX}seqmon0"
device.scopes[SCOPE_IDX].trigger.channel(SCOPE_TRIGGER_CHANNEL)

# trigger the sequencer using the software trigger
SOFTWARE_TRIGGER = "software_trigger0"
GENERATOR_AUXTRIGGER_INDEX = 0  # always use the first trigger input of the sequencer
device.qachannels[CHANNEL_INDEX].generator.auxtriggers[
    GENERATOR_AUXTRIGGER_INDEX
].channel(SOFTWARE_TRIGGER)

SCOPE_TRIGGER_DELAY = 200e-9

# important: set the integration delay equal to the scope trigger delay, since
# we are going to use recorded scope traces as reference traces for the state
# discrimination.
device.qachannels[CHANNEL_INDEX].readout.integration.delay(SCOPE_TRIGGER_DELAY)
Define simulated multistate signals#
For the sake of demonstration within a loopback configuration, we upload pre-computed simulated reference signals for up to 4 states and modulate them with different frequencies to simulate multiple qudits.
In an actual multistate discrimination measurement, the same readout pulse must be generated independenlty of the qudit state.
[4]:
# dictionary mapping the qudit index to the number of states
if device.max_qubits_per_channel >= 16:
    QUDITS_NUM_STATES = {0: 3, 1: 4, 2: 3, 3: 2, 4: 4}
else:
    QUDITS_NUM_STATES = {0: 3, 1: 4}

# Note: Since we only have 16 (8 on the SHFQA2 without 16W option) waveform generator units,
# we have to restrict the total number of states, summed over all qudits, to less than 16
total_num_states = sum(QUDITS_NUM_STATES.values())
assert total_num_states <= device.max_qubits_per_channel, (
    "Cannot upload all simulated waveforms as the total number of states, "
    f"summed over all qudits, amounts to {total_num_states}, "
    f"which is more than the number of {device.max_qubits_per_channel} "
    "generator waveforms on the device."
)
[5]:
# load simulated reference traces exported using ../model/multi_state_discrimination.ipynb
signals_simulated = np.loadtxt(
    "resources/example_multistate_signals.csv", dtype="complex128"
)

# check that enough simulated traces are available to cover all states
assert len(signals_simulated) >= max(QUDITS_NUM_STATES.values())
[6]:
from zhinst.utils.shfqa import SHFQA_SAMPLING_FREQUENCY

# Note: we reuse the number of samples also for the scope measurement
num_samples = signals_simulated.shape[1]

# define time axis for the simulated signals
signals_time = np.linspace(0, num_samples / SHFQA_SAMPLING_FREQUENCY, num_samples)
Here, we define different modulation frequencies for each qudit and modulate the simulated signals with these frequencies.
[7]:
# dictionary mapping the qudit index to the modulation frequency
QUDITS_FREQUENCIES = {0: -10e6, 1: -5e6, 2: 0e6, 3: 5e6, 4: 10e6}


qudits_signals = {}

for qudit_idx, num_states in QUDITS_NUM_STATES.items():
    # Define dictionary of signal for each state
    # Note: the signal also has to be scaled down by dividing
    # by the number of qudits in order to allow for parallel
    # playback of the signals for multiple qudits.
    states_signals = []
    for signal_idx, signal in enumerate(signals_simulated[:num_states]):
        states_signals.append(
            signal
            * np.exp(2j * np.pi * QUDITS_FREQUENCIES[qudit_idx] * signals_time)
            / len(QUDITS_NUM_STATES)
        )
    qudits_signals[qudit_idx] = states_signals
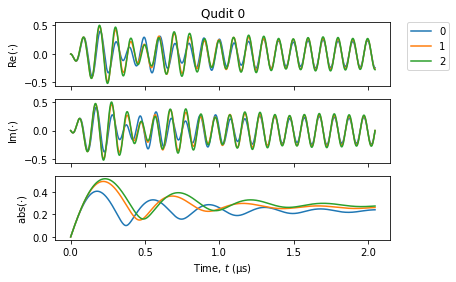
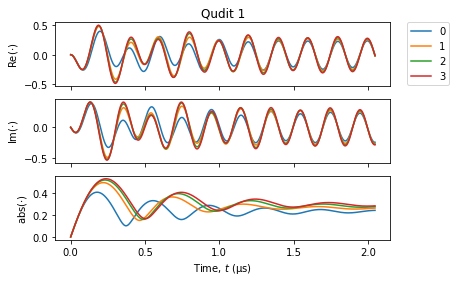
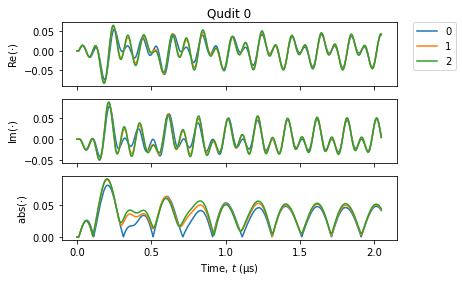
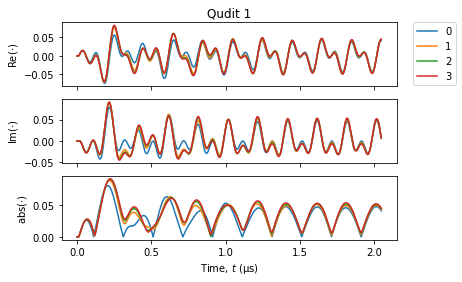
Next, we plot the signals before uploading them to the device
[8]:
def plot_complex_signals(
    signals: t.List[np.ndarray],
    signals_time: np.ndarray,
    title: str = None,
) -> None:
    """Helper function to plot complex signals.
    The function plots the real, imaginary and absolute values of the signal

    Args:
        signals: List of signals to be plotted.
        signals_time: Common time axis defintion (in seconds) for each signal.
            The time axis will be displayed in units of microseconds.
        title (optional): Specifies the title of the plot.
    """
    fig, axs = plt.subplots(3, sharex=True)
    for sig_key, sig in enumerate(signals):
        axs[0].plot(signals_time * 1e6, np.real(sig), label=sig_key)  # plot real part
        axs[1].plot(
            signals_time * 1e6, np.imag(sig), label=sig_key
        )  # plot imaginary part
        axs[2].plot(
            signals_time * 1e6, np.abs(sig), label=sig_key
        )  # plot absolute value

    axs[2].set_xlabel(r"Time, $t$ ($\mathrm{\mu s})$")
    axs[0].set_ylabel(r"$\mathrm{Re}(\cdot)$")
    axs[1].set_ylabel(r"$\mathrm{Im}(\cdot)$")
    axs[2].set_ylabel(r"$\mathrm{abs}(\cdot)$")
    axs[0].legend(bbox_to_anchor=(1.05, 1), loc="upper left", borderaxespad=0.0)
    if title:
        axs[0].set_title(title)
    plt.show()


for qudit_idx, state_signals in qudits_signals.items():
    plot_complex_signals(state_signals, signals_time, title=f"Qudit {qudit_idx}")
Upload simulated waveforms to the device#
Now upload all simulated signals to the generator waveforms on the device.
We also define a dictionary to remember the mapping from qudit and state to waveform index, which is needed for interpreting the segmented scope shots and readout results.
[9]:
WAVEFORM_IDX_MAPPING = {}

simulated_waveforms = Waveforms()

waveform_idx = 0
for qudit_idx, states_signals in qudits_signals.items():
    for state_idx, signal in enumerate(states_signals):
        simulated_waveforms.assign_waveform(slot=waveform_idx, wave1=signal)
        WAVEFORM_IDX_MAPPING[(qudit_idx, state_idx)] = waveform_idx
        waveform_idx += 1

# upload the waveforms to the device
device.qachannels[CHANNEL_INDEX].generator.write_to_waveform_memory(simulated_waveforms)
Program the Sequencer#
[10]:
import textwrap


def simulated_qudit_seqc_program(
    qudits_num_states: t.Dict[int, int],
    wvfm_idx_mapping: t.Dict[t.Tuple[int, int], int],
    num_repetitions: int,
    cycle_time: float = 4e-6,
) -> str:
    """
    Generates a Sequencer C (SeqC) program for simulated multi-qudit readout.

    The states of each qudit are counted up subsequently while keeping the other qudits in the ground state.

    Args:
        qudits_num_states: Dictionary specifying for each qudit index how many states the qubit has.
        wvfm_idx_mapping: Dictionary specifying for
        num_repetitions: Number of repetitions of the entire experiment
        cycle_time: The time each cycle of the experiment loop takes.

    Returns:
        Sequencer C program as a string.
    """

    assert (
        sum(qudits_num_states.values()) <= 16
    ), "the playback of simulated traces is limited to 16 waveforms"

    seqc_program = textwrap.dedent(
        f"""
        const PLAY_ZERO_CYCLES = {cycle_time} * DEVICE_SAMPLE_RATE;

        info("PLAY_ZERO_CYCLES: %d", PLAY_ZERO_CYCLES);

        repeat({num_repetitions}) {{
    """
    )

    # generate maks to enable the integration of all qudits in the dictionary
    qa_int_mask = ""
    for qudit_idx in qudits_num_states.keys():
        if qa_int_mask:
            qa_int_mask += " | "
        qa_int_mask += f"QA_INT_{qudit_idx}"

    for qudit_idx, num_states in qudits_num_states.items():

        # index of the generator holding the waveform for the first state of the qudit
        first_wave_idx = wvfm_idx_mapping[(qudit_idx, 0)]

        # generate mask to enable the first state of the other qudits
        other_qudits_gen_mask = 0
        for other_qudit_idx in qudits_num_states.keys():
            if other_qudit_idx != qudit_idx:
                other_qudits_gen_mask |= 1 << wvfm_idx_mapping[(other_qudit_idx, 0)]

        seqc_program += textwrap.indent(
            textwrap.dedent(
                f"""
            // generate and measure refrence traces for qudit {qudit_idx}
            for(cvar i = 0; i < {num_states}; i++) {{

                // mask to enable the playback of the simulated trace
                // for a specific qudit state
                cvar gen_mask = (1 << ({first_wave_idx} + i));

                // enable other qudits, if requested
                gen_mask |= 0b{other_qudits_gen_mask:016b};

                // wait for the next repetition period
                playZero(PLAY_ZERO_CYCLES);

                // play back different waveforms based on the bit mask
                // and measure the qudit
                startQA(gen_mask, {qa_int_mask}, true,  0, 0x0);
            }}
        """
            ),
            "    ",
        )

    seqc_program += textwrap.dedent(
        """
        } // end of repeat({num_repetitions})
    """
    )
    return seqc_program


NUM_REPETITONS = 2000

seqc_program = simulated_qudit_seqc_program(
    QUDITS_NUM_STATES, WAVEFORM_IDX_MAPPING, num_repetitions=NUM_REPETITONS
)


device.qachannels[CHANNEL_INDEX].generator.load_sequencer_program(seqc_program)
[10]:
{'messages': 'Info: PLAY_ZERO_CYCLES: 8000\n', 'maxelfsize': 2147483648}
Measure the reference traces#
Here, we configure the scope to measure the reference traces.
[11]:
SCOPE_CHANNEL = 0

device.scopes[SCOPE_IDX].configure(
    input_select={SCOPE_CHANNEL: f"channel{CHANNEL_INDEX}_signal_input"},
    num_samples=signals_simulated.shape[1],
    trigger_input=SCOPE_TRIGGER_CHANNEL,
    num_segments=total_num_states,
    num_averages=NUM_REPETITONS,
    trigger_delay=SCOPE_TRIGGER_DELAY,
)
Now, we perform the scope measurement of the reference traces for each qudit.
[12]:
# Arm the scope
device.scopes[SCOPE_CHANNEL].run(single=True)

# Run the sequencer
device.qachannels[CHANNEL_INDEX].generator.enable_sequencer(single=True)

# Get the scope results
scope_data, *_ = device.scopes[SCOPE_IDX].read()
[13]:
# reshape scope data according to segments
scope_data_segments = np.reshape(
    scope_data[SCOPE_CHANNEL], [total_num_states, num_samples]
)

# build list of reference traces for each qudit
qudits_ref_traces = {}
for qudit_idx, num_states in QUDITS_NUM_STATES.items():
    ref_traces = []
    for state_idx in range(num_states):
        ref_traces.append(
            scope_data_segments[WAVEFORM_IDX_MAPPING[(qudit_idx, state_idx)]]
        )

    qudits_ref_traces[qudit_idx] = ref_traces
Now plot the measured reference traces
[14]:
for qudit_idx, ref_traces in qudits_ref_traces.items():
    plot_complex_signals(ref_traces, signals_time, title=f"Qudit {qudit_idx}")
Define the Qudit Settings#
The multistate utilities are used to infer the qudit settings from the list of reference traces.
[15]:
all_qudit_settings = {}

for qudit_idx, ref_traces in qudits_ref_traces.items():
    # infer the qudit settings from the list of reference traces
    all_qudit_settings[qudit_idx] = QuditSettings(ref_traces)
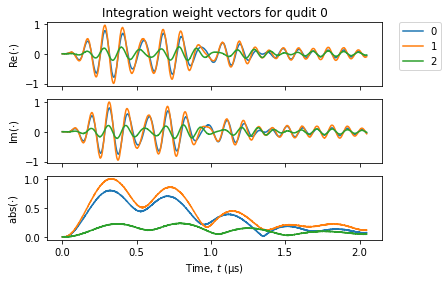
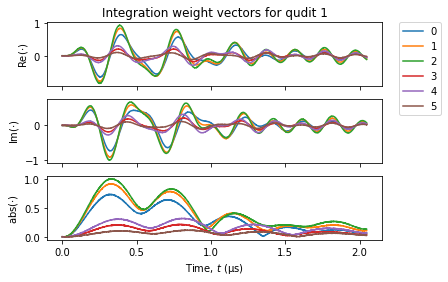
Plot the integration weights vectors#
Note: there are d * (d - 1) / 2 weight vectors for each qudit:
d = 2 (qubit): 1 weight vector
d = 3 (qutrit): 3 weight vectors
d = 4 (ququad): 6 weight vectors
[16]:
def plot_integration_weights(
    qudit_settings: QuditSettings, signals_time, title=None
) -> None:
    """Plots the integration weight vectors belonging to the qudit settings.
    Args:
        qudit_settings:
    """
    # build list of signals
    signals = []
    for weight in qudit_settings.weights:
        signals.append(weight.vector)

    plot_complex_signals(signals, signals_time, title=title)


for qudit_idx, qudit_settings in all_qudit_settings.items():
    plot_integration_weights(
        qudit_settings,
        signals_time,
        title=f"Integration weight vectors for qudit {qudit_idx}",
    )
Configure the qudit settings to the device#
After defining the qudit settings, we can configure them to the device.
[17]:
# Make sure all qudits are disabled before configuring them
device.qachannels[CHANNEL_INDEX].readout.multistate.qudits["*"].enable(0)

# Configure the new qudit settings on the device
for qudit_idx, qudit_settings in all_qudit_settings.items():
    device.qachannels[CHANNEL_INDEX].readout.multistate.qudits[qudit_idx].configure(
        qudit_settings
    )

# Enable the multistate discrimination
device.qachannels[CHANNEL_INDEX].readout.multistate.enable(1)
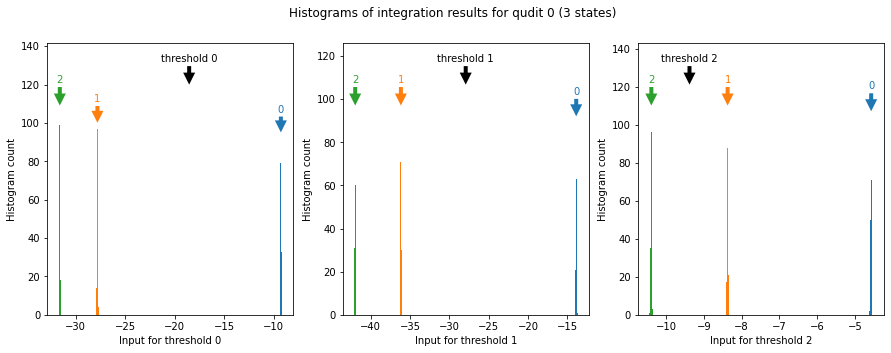
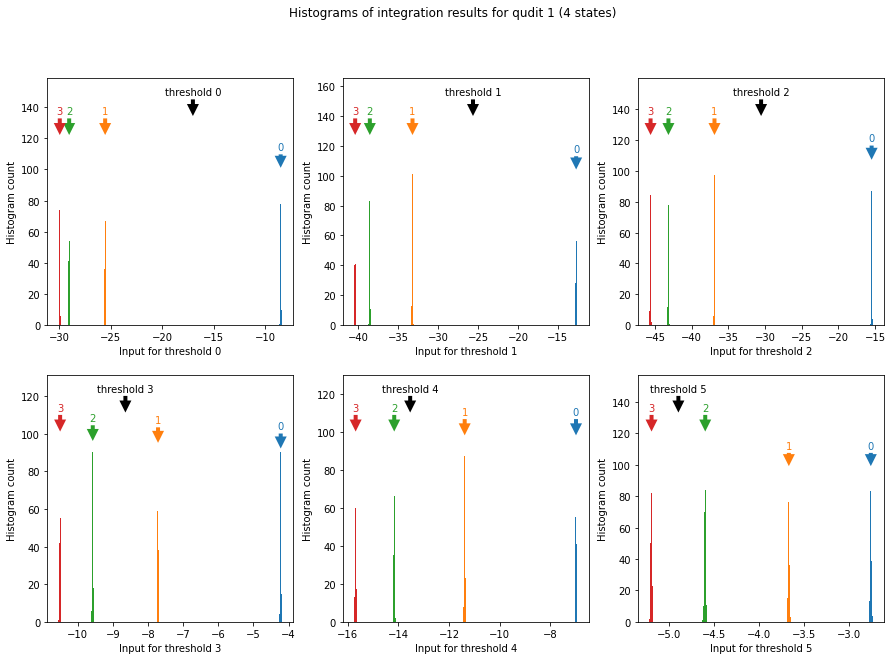
Measure the integration results#
Here, we measure the integration results and plot histograms. This intermediate step is useful for debugging. It is possible to skip this section and directly execute the next section, where we measure the results from the discrimination unit.
[18]:
result_length = NUM_REPETITONS * total_num_states

# Configure the result logger
device.qachannels[CHANNEL_INDEX].readout.configure_result_logger(
    result_length=result_length, result_source="result_of_integration"
)

# Arm the result logger
device.qachannels[CHANNEL_INDEX].readout.run()

# Run the sequencer
device.qachannels[CHANNEL_INDEX].generator.enable_sequencer(single=True)
[19]:
# Download the results
qudit_int_results = device.qachannels[
    CHANNEL_INDEX
].readout.multistate.get_qudits_results()
Now, we reshape the integration results according to the order of the played simulated waveforms.
[20]:
def reshape_integration_results(
    results, qudits_num_states, wvfm_idx_mapping, num_repetitions
) -> t.List[np.ndarray]:
    """Reshape integration results according to the waveform index mapping."""
    qudits_extracted_results = []
    total_num_states = sum(qudits_num_states.values())

    for qudit_idx, result in results.items():
        num_states = qudits_num_states[qudit_idx]
        # we expect the number of integrators to be the number of states minus one:
        num_integrators = num_states - 1
        assert len(result) == num_integrators

        # reserve space for the extracted results
        # the meaning of the array indices will be: integrator index, repetition index, state index
        extracted_results = np.zeros(
            (num_integrators, num_repetitions, num_states), dtype="complex128"
        )

        # iterate over the integrators
        for integ_idx, result in enumerate(result):

            # extract the results corresponding to the specific qudit states
            for state_idx in range(num_states):
                trace_idx = wvfm_idx_mapping[(qudit_idx, state_idx)]
                # the reference trace is expected to be repeated with periodicity given by "total_num_states"
                extracted_results[integ_idx, :, state_idx] = result[
                    trace_idx::total_num_states
                ]

        # append to qudits list
        qudits_extracted_results.append(extracted_results)

    return qudits_extracted_results


qudits_ref_results = reshape_integration_results(
    qudit_int_results,
    qudits_num_states=QUDITS_NUM_STATES,
    wvfm_idx_mapping=WAVEFORM_IDX_MAPPING,
    num_repetitions=NUM_REPETITONS,
)
To plot the integration results together with all thresholds, we also compute the pairwise differences which are computed on the device.
[21]:
import itertools


def pairwise_diff(integration_results: np.ndarray) -> np.array:
    """Calculates the pairwise difference of integration results.

    The pairwise difference is calculated for all combinations of integration
    results using the same order and sign convention as used in the real-time
    computation on the device.

    Args:
        integration_results (array): Two-dimensional array of integration results
            with shape (m, l), where m is the number of integrators and l is
            the size of an arbitrary inner dimension of a vector of results.

    Returns:
        Two-dimensional array with shape (m*(m - 1)/2, l)
    """
    return np.array(
        [
            integration_results[idx1] - integration_results[idx0]
            for idx0, idx1 in itertools.combinations(range(len(integration_results)), 2)
        ]
    )


def stack_pairwise_diff(integration_results: np.ndarray) -> np.array:
    """Calculates and stacks the pairwise difference of integration results.

    The pairwise difference is calculated for all combinations of integration
    results using the same order and sign convention as used in the real-time
    computation on the device. Furthermore, this function stacks the original
    array of integration results with the array of pairwise differences.

    Args:
        integration_results (array): Two-dimensional array of integration results
            with shape (m, l), where m is the number of integrators and l is
            the size of an arbitrary inner dimension of a vector of results.

    Returns:
         Two-dimensional array with shape (m*(m + 1)/2, l)
    """
    if len(integration_results) < 2:
        # nothing to be stacked as there are no pairwise differences
        return integration_results

    diffs = pairwise_diff(integration_results)
    results_combined = np.concatenate((integration_results, diffs), axis=0)

    return results_combined


# the results for 1-vs-1 classification are obtained by stacking the results from the weighted integration and the pairwise differences
readout_results_1vs1 = [stack_pairwise_diff(result) for result in qudits_ref_results]
[22]:
from zhinst.utils.shfqa.multistate import weighted_integration


def plot_threshold_histograms(
    readout_results: np.ndarray, qudit_settings: QuditSettings, title=None
):

    # Figure size
    NUM_OF_FIGURES_PER_ROW = 3
    fig_height = 10 if len(qudit_settings.thresholds) > NUM_OF_FIGURES_PER_ROW else 5
    fig_width = 5 * min(len(qudit_settings.thresholds), NUM_OF_FIGURES_PER_ROW)
    figsize = (fig_width, fig_height)
    plt.figure(figsize=figsize)

    # Number of subplots
    subplots_rows = 2 if len(qudit_settings.thresholds) > NUM_OF_FIGURES_PER_ROW else 1
    subplots_cols = min(len(qudit_settings.thresholds), NUM_OF_FIGURES_PER_ROW)

    for threshold_idx, threshold in enumerate(qudit_settings.thresholds):
        plt.subplot(subplots_rows, subplots_cols, threshold_idx + 1)

        max_count_overall = 0
        for state_idx, state in qudit_settings.states.items():
            # define a common color for all plot elements
            color = plt.rcParams["axes.prop_cycle"].by_key()["color"][state_idx]

            histogram_counts, _, _ = plt.hist(
                readout_results[threshold_idx, :, state_idx].real,
                color=color,
                label=state.label,
                bins=60,
            )

            max_count = np.max(histogram_counts)
            if max_count > max_count_overall:
                max_count_overall = max_count

            weight = qudit_settings.weights[threshold_idx]
            ideal_result = np.real(weighted_integration(weight.vector, state.ref_trace))

            plt.annotate(
                state.label,
                xy=(ideal_result, max_count_overall),
                xycoords="data",
                xytext=(ideal_result, 1.1 * max_count_overall),
                textcoords="data",
                color=color,
                arrowprops=dict(facecolor=color, shrink=0.01, linestyle="none"),
                horizontalalignment="center",
                verticalalignment="bottom",
            )

        plt.annotate(
            f"threshold {threshold_idx}",
            xy=(threshold.real, 1.1 * max_count_overall),
            xycoords="data",
            xytext=(threshold.real, 1.2 * max_count_overall),
            textcoords="data",
            arrowprops=dict(facecolor="black", shrink=0.01, linestyle="none"),
            horizontalalignment="center",
            verticalalignment="bottom",
        )

        plt.xlabel(f"Input for threshold {threshold_idx}")
        plt.ylabel("Histogram count")
        plt.ylim([0, 1.3 * max_count_overall])

    if title:
        plt.suptitle(title)

    plt.show()


for qudit_idx, results in enumerate(readout_results_1vs1):
    plot_threshold_histograms(
        results,
        all_qudit_settings[qudit_idx],
        title=f"Histograms of integration results for qudit {qudit_idx} ({QUDITS_NUM_STATES[qudit_idx]} states)",
    )
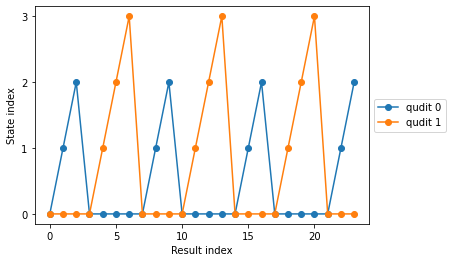
Measure the discrimination results for each qudit#
Running the multistate discrimination measurement is done the same way as for a normal qubit readout.
[23]:
result_length = NUM_REPETITONS * total_num_states

# Configure the result logger
device.qachannels[CHANNEL_INDEX].readout.configure_result_logger(
    result_length=result_length, result_source="result_of_discrimination"
)

# Arm the result logger
device.qachannels[CHANNEL_INDEX].readout.run()

# Run the sequencer
device.qachannels[CHANNEL_INDEX].generator.enable_sequencer(single=True)
Download the results from the result logger
[24]:
# Download the results
qudits_results = device.qachannels[
    CHANNEL_INDEX
].readout.multistate.get_qudits_results()
[25]:
def plot_discrimination_results(results, max_samples=24):
    """Function to plot the first samples of a result vector"""
    max_state = 0
    for qudit_idx, result_vector in results.items():
        result_len = min(len(result_vector), max_samples)
        max_state = max(np.max(result_vector), max_state)
        if not np.all(np.isnan(result_vector)):
            plt.plot(result_vector[:result_len], marker="o", label=f"qudit {qudit_idx}")

    plt.yticks(np.arange(max_state + 1, dtype=int))
    plt.xlabel("Result index")
    plt.ylabel("State index")
    plt.legend(loc="center left", bbox_to_anchor=(1, 0.5))
    plt.show()


plot_discrimination_results(qudits_results)
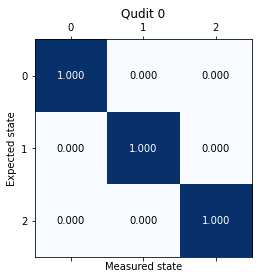
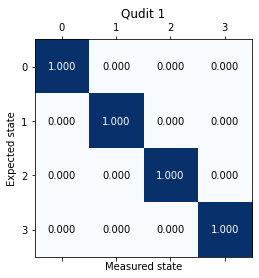
Calculate assignment fidelity matrix#
[26]:
def calc_expected_qudits_results(qudits_num_states, result_len):
    """Calculates the expected discrimination results.

    The states of each qudit are counted up subsequently while keeping the other
    qudits in the ground state.
    """
    expected_qudits_results = {}
    total_num_states = sum(qudits_num_states.values())
    first_state_idx = 0
    for qudit_idx, num_states in qudits_num_states.items():
        expected_result_vector = np.zeros(result_len, dtype=int)
        start_idx = first_state_idx
        qudit_states = np.arange(num_states, dtype=int)
        while start_idx < result_len:
            end_idx = min(start_idx + num_states, result_len)
            expected_result_vector[start_idx:end_idx] = qudit_states
            start_idx += total_num_states
        expected_qudits_results[qudit_idx] = expected_result_vector
        # the states of the next qudit will start counting up only after the states of this qudit
        first_state_idx += num_states

    return expected_qudits_results


expected_qudits_results = calc_expected_qudits_results(
    QUDITS_NUM_STATES, len(qudits_results[0])
)
[27]:
def calc_fidelity_matrix(measured_results, expected_results, num_states):
    """Calculates the fidelity matrix.

    Row indices correspond to the expected state, Column indices to the actual state
    """

    fidelity_matrix = np.zeros([num_states, num_states])
    for expected_state, measured_state in zip(expected_results, measured_results):
        fidelity_matrix[expected_state, measured_state] += 1

    # normalize row-by-row by the expected number of occurrences for each state
    for (
        expected_state,
        matrix_row,
    ) in enumerate(fidelity_matrix):
        state_sum = np.sum(expected_results == expected_state)
        fidelity_matrix[expected_state] = fidelity_matrix[expected_state] / state_sum

    return fidelity_matrix


qudits_fidelity_matrix = {}

for qudit_idx, result_vector in qudits_results.items():

    qudits_fidelity_matrix[qudit_idx] = calc_fidelity_matrix(
        result_vector,
        expected_qudits_results[qudit_idx],
        QUDITS_NUM_STATES[qudit_idx],
    )
[28]:
def plot_fidelity_matrix(matrix, title=None):
    fig, ax = plt.subplots()
    min_val, max_val = 0, 5

    ax.matshow(matrix, cmap="Blues")

    for iy, ix in np.ndindex(matrix.shape):
        value = matrix[iy, ix]
        color = "black" if value < 0.5 else "white"
        ax.text(ix, iy, f"{value:0.3f}", va="center", ha="center", color=color)

    plt.xlabel("Measured state")
    plt.ylabel("Expected state")

    if title:
        plt.title(title)

    plt.show()


for qudit_idx, fidelity_matrix in qudits_fidelity_matrix.items():
    plot_fidelity_matrix(fidelity_matrix, title=f"Qudit {qudit_idx}")