User Interface Overview
UI Nomenclature
This section provides an overview of the LabOne User Interface, its main elements and naming conventions. The LabOne User Interface is a browser-based UI provided as the primary interface to the PQSC instrument. Multiple browser sessions can access the instrument simultaneously and the user can have displays on multiple computer screens. Parallel to the UI, the instrument can be controlled and read out by custom programs written in any of the supported languages (e.g. LabVIEW, MATLAB, Python, C) connecting through the LabOne APIs.
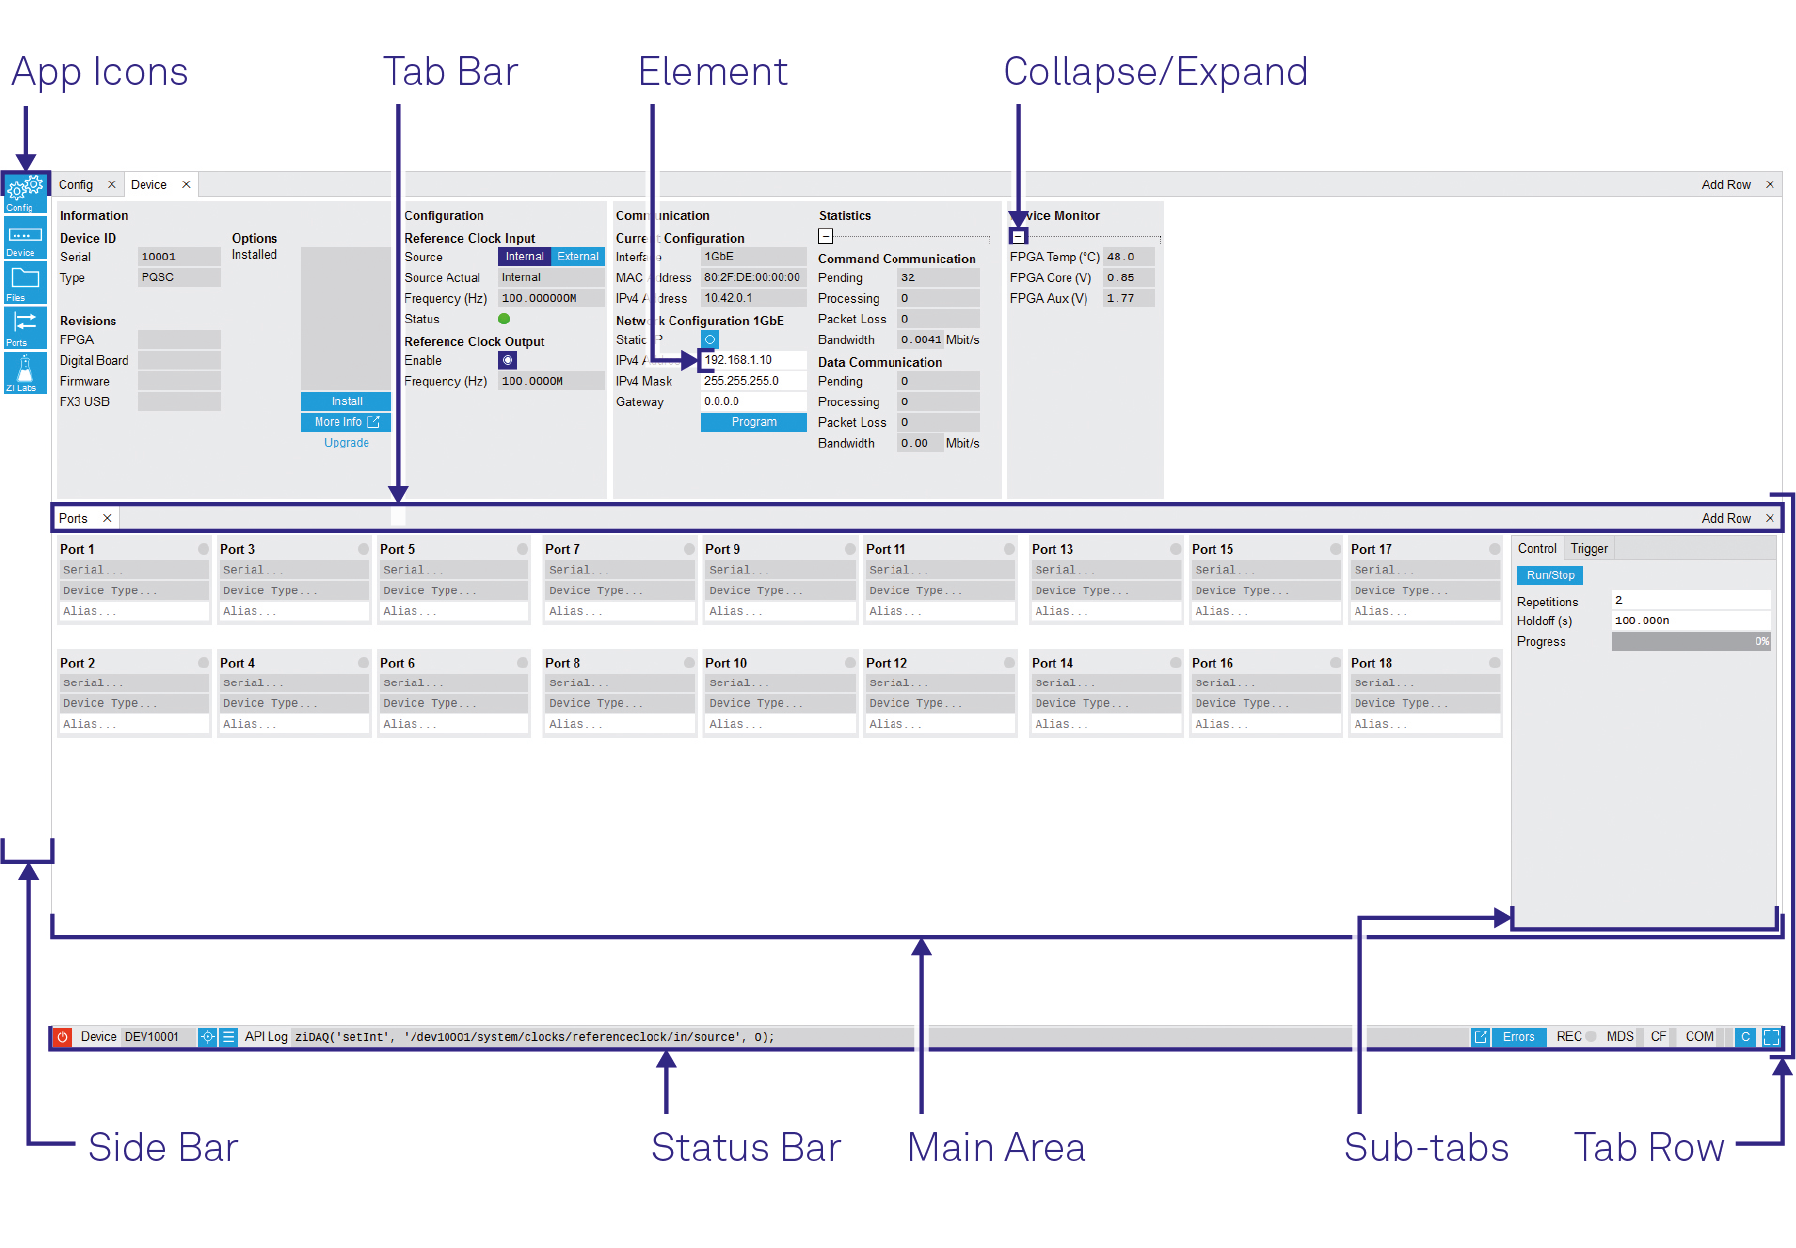
The LabOne User Interface automatically opens some tabs by default after a new UI session has been started. At start-up, the UI is divided into two tab rows, each containing a tab structure that gives access to the different LabOne tools. Depending on display size and application, tab rows can be freely added and deleted with the control elements on the right-hand side of each tab bar. Similarly, the individual tabs can be deleted or added by selecting app icons from the side bar on the left. A click on an icon adds the corresponding tab to the display, alternatively the icon can be dragged and dropped into one of the tab rows. Moreover, tabs can be moved by drag-and-drop within a row or across rows.
Table 1 gives a brief descriptions and naming conventions for the most important UI items.
| Item name | Position | Description | Contains |
|---|---|---|---|
| side bar | left-hand side of the UI | contains app icons for each of the available tabs - a click on an icon adds or activates the corresponding tab in the active tab row | app icons |
| status bar | bottom of the UI | contains important status and warning indicators, device and session information, and access to the command log | status indicators |
| main area | center of the UI | accommodates all active tabs – new rows can be added and removed by using the control elements in the top right corner of each tab row | tab rows, each consisting of tab bar and the active tab area |
| tab area | inside of each tab | provides the active part of each tab consisting of settings, controls and measurement tools | sections, plots, sub-tabs, unit selections |
Unique Set of Analysis Tools
All instruments feature a comprehensive tool set for connecting and synchronizing multiple instruments.
The following table gives the overview of all app icons. Note that the selection of app icons may depend on the upgrade options installed on a given instrument.
| Control/Tool | Option/Range | Description |
|---|---|---|
| Files | Access settings and measurement data files on the host computer. | |
| Config | Provides access to software configuration. | |
| Ports | Control and status display of the ZSync ports. | |
| Feedback | Control and display of the feedback pipeline. | |
| Device | Provides instrument specific settings. | |
| ZI Labs | Experimental settings and controls. |
Table 3 provides a quick overview over the different status bar elements along with a short description.
| Control/Tool | Option/Range | Description |
|---|---|---|
| Command log | last command | Shows the last command. A different formatting (MATLAB, Python, ..) can be set in the config tab. The log is also saved in [User]\Documents\Zurich Instruments\LabOne\WebServer\Log |
| Show Log |  |
Show the command log history in a separate browser window. |
| Errors | Errors | Display system errors in separate browser tab. |
| Device | devXXX | Indicates the device serial number. |
| Identify Device |  |
When active, device LED blinks |
| Shutdown | Shuts down the instrument. | |
| CLK | yellow/green/red | State of internal clocks. Yellow: Device is warming up and will be ready 30 minutes after power-up. Do not lock to external reference clock or start triggering yet. Green: Device is warmed up and ready to use. Red: Clocks have become unstable. Expect potential phase errors. This might be caused by temperature changes. |
| MDS | grey/green/red/yellow | Multiple device synchronization indicator. Grey: Nothing to synchronize - single device on the UI. Green: All devices on the UI are correctly synchronized. Yellow: MDS sync in progress or only a subset of the connected devices is synchronized. Red: Devices not synchronized or error during MDS sync. |
| REC | grey/red | A blinking red indicator shows ongoing data recording (related to global recording settings in the Config tab). |
| CF | grey/yellow/red | Clock Failure - Red: present malfunction of the external 10 MHz reference oscillator. Yellow: indicates a malfunction occurred in the past. |
| COM | grey/yellow/red | Packet Loss - Red: present loss of data between the device and the host PC. Yellow: indicates a loss occurred in the past. |
| COM | grey/yellow/red | Sample Loss - Red: present loss of sample data between the device and the host PC. Yellow: indicates a loss occurred in the past. |
| Reset status flags | Clear the current state of the status flags | |
| Full Screen |  |
Toggles the browser between full screen and normal mode. |