Warning!
This is an archived version of the documentation.
It is strongly advised to use the latest version available at
https://docs.zhinst.com/zhinst-qcodes/en/latest/index.html
MFLI
We use the ziqc.MFLI instrument driver for the MFLI Lock-In amplifier.
[1]:
import numpy as np
import matplotlib.pyplot as plt

import qcodes as qc
import zhinst.qcodes as ziqc

mfli = ziqc.MFLI("mf1", "dev3337", interface="pcie", host="10.42.3.78")
Successfully connected to data server at 10.42.3.788004 api version: 6
Successfully connected to device DEV3337 on interface PCIE
Connected to: Zurich Instruments MFLI (serial:dev3337, firmware:65939) in 0.72s
Nodetree
Access the MFLI’s nodetree:
[2]:
print([k for k in mfli.submodules.keys()])
print([k for k in mfli.parameters.keys()])
['daq', 'sweeper', 'stats', 'oscs', 'demods', 'extrefs', 'triggers', 'status', 'dios', 'auxins', 'system', 'sigins', 'currins', 'sigouts', 'mods', 'pids', 'features', 'auxouts', 'tu', 'imps']
['IDN', 'clockbase']
The Parameter sample of the demodulators uses the getSample(...) method of the ziPython API to read the latest sample of the demodulator.
[3]:
mfli.demods[0].sample()
[3]:
(1.1122721315802995e-06-4.346413905575501e-07j)
⚠️ Note that this parameter only returns a single sample. There is no guarantee for any precise time-relation between consecutive samples. For proper (triggered) data acquisition of signals aligned to a precise time-grid, please use the Data Acquisition Module (see below).
The Data Acquisition Module of the MFLI
The MFLI comes with a Data Acquisition Module for precise (triggered) measurements. For more details on the Data Acquisition Module please see the according example.
[4]:
print([k for k in mfli.daq.parameters.keys()])
['awgcontrol', 'bandwidth', 'bitmask', 'bits', 'buffercount', 'buffersize', 'clearhistory', 'count', 'delay', 'device', 'duration', 'edge', 'enable', 'endless', 'eventcount_mode', 'fft_absolute', 'fft_window', 'findlevel', 'flags', 'forcetrigger', 'grid_cols', 'grid_direction', 'grid_mode', 'grid_overwrite', 'grid_repetitions', 'grid_rowrepetition', 'grid_rows', 'grid_waterfall', 'historylength', 'holdoff_count', 'holdoff_time', 'hysteresis', 'level', 'preview', 'pulse_max', 'pulse_min', 'refreshrate', 'save_csvlocale', 'save_csvseparator', 'save_directory', 'save_fileformat', 'save_filename', 'save_save', 'save_saveonread', 'spectrum_autobandwidth', 'spectrum_enable', 'spectrum_frequencyspan', 'spectrum_overlapped', 'triggered', 'triggernode', 'type']
List available sources of streaming signals …
[5]:
mfli.daq.signals_list()
[5]:
['dio0',
 'auxin0',
 'scope0',
 'demod0',
 'demod1',
 'demod2',
 'demod3',
 'pid0_value',
 'pid0_error',
 'pid0_shift',
 'pid1_value',
 'pid1_error',
 'pid1_shift',
 'pid2_value',
 'pid2_error',
 'pid2_shift',
 'pid3_value',
 'pid3_error',
 'pid3_shift',
 'imp0',
 'imp1']
… and different signal types for a given source.
[6]:
mfli.daq.signals_list("demod0")
[6]:
['x', 'y', 'r', 'xiy', 'theta', 'frequency', 'auxin0', 'auxin1', 'dio']
Use the method signals_add(..) to specify which signals should be acquired during a measurement. The return value gives the exact node path that will be subscribed to before the measurement.
[7]:
demod_x = mfli.daq.signals_add("demod0", "x")
demod_y = mfli.daq.signals_add("demod0", "y")

# which signal nodes have been added?
print(mfli.daq.signals)
['/dev3337/demods/0/sample.x.avg', '/dev3337/demods/0/sample.y.avg']
Use trigger type, grid columns, grid rows and other parameters to configure the measurement you want.
[8]:
mfli.daq.type("continuous")
mfli.daq.grid_cols(100)
mfli.daq.grid_rows(100)
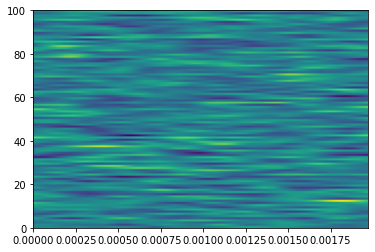
The measurement routine is started using the measure(...) method. At first, the mdoule will subscribe to the signal nodes that were previously added to the measurement. Then the measurement is started. When it is finished, the results will be added to the results property of the daq Module.
[9]:
mfli.daq.measure()
subscribed to: /dev3337/demods/0/sample.x.avg
subscribed to: /dev3337/demods/0/sample.y.avg
Progress: 0.0%
Progress: 1.0%
Progress: 7.0%
Progress: 15.0%
Progress: 23.0%
Progress: 34.0%
Progress: 42.0%
Progress: 49.0%
Progress: 56.0%
Progress: 64.0%
Progress: 72.0%
Progress: 80.0%
Progress: 89.0%
Progress: 98.0%
Finished
The results property is a dictionary with the exact signal node as its keys. The return value from signals_add(..) can be used to access the result of that signal. The value in the dictionary is a DAQResult object that contains all measurement information such as the measurement values, the time- or frequency-axis as well as meta-information.
[10]:
mfli.daq.results[demod_x]
[10]:
<zhinst.toolkit.control.drivers.base.daq.DAQResult object at 0x000002409DA3E3C8>

path:        /dev3337/demods/0/sample.x.avg
value:       (100, 100)
time:        (100,)
[11]:
mfli.daq.results[demod_y]
[11]:
<zhinst.toolkit.control.drivers.base.daq.DAQResult object at 0x000002409DA3E400>

path:        /dev3337/demods/0/sample.y.avg
value:       (100, 100)
time:        (100,)
[12]:
import matplotlib.pyplot as plt

result_x = mfli.daq.results[demod_x]

plt.imshow(result_x.value, extent=[result_x.time[0], result_x.time[-1], 0, 100], aspect="auto")
plt.show()

The Sweeper Module of the MFLI
The MFLI also features a Sweeper Module. For more details on the Sweeper Module please see the according example. The module has all of the following Parameters:
[13]:
print([k for k in mfli.sweeper.parameters.keys()])
['averaging_sample', 'averaging_tc', 'averaging_time', 'awgcontrol', 'bandwidth', 'bandwidthcontrol', 'bandwidthoverlap', 'clearhistory', 'device', 'endless', 'gridnode', 'historylength', 'loopcount', 'maxbandwidth', 'omegasuppression', 'order', 'phaseunwrap', 'remainingtime', 'samplecount', 'save_csvlocale', 'save_csvseparator', 'save_directory', 'save_fileformat', 'save_filename', 'save_save', 'save_saveonread', 'scan', 'settling_inaccuracy', 'settling_tc', 'settling_time', 'sincfilter', 'start', 'stop', 'xmapping']
As for the Data Acquisition Module the available signal sources can be shown with signals_list(...). They can differ depending on the options installed in the instrument.
[14]:
mfli.sweeper.signals_list()
[14]:
['dio0',
 'auxin0',
 'scope0',
 'demod0',
 'demod1',
 'demod2',
 'demod3',
 'pid0_value',
 'pid0_error',
 'pid0_shift',
 'pid1_value',
 'pid1_error',
 'pid1_shift',
 'pid2_value',
 'pid2_error',
 'pid2_shift',
 'pid3_value',
 'pid3_error',
 'pid3_shift',
 'imp0',
 'imp1']
The Parameters that are available for sweeping can be listed with sweep_parameter_list().
As for the Data Acquisition Module the available signal sources can be shown with signals_list(...). They can differ depending on the options installed in the instrument.
The device parameters that are available for sweeping can be listed with sweep_parameter_list():
[15]:
mfli.sweeper.sweep_parameter_list()
[15]:
['auxout0offset',
 'auxout1offset',
 'auxout2offset',
 'auxout3offset',
 'demdod0phase',
 'demdod1phase',
 'frequency',
 'output0amp',
 'output0offset']
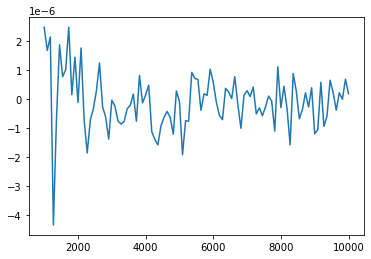
A typical frequency sweep from 1-10 kHz and 100 steps is configured as follows. We add the signal from the first demodulator (‘demod0’) to the measurement.
[16]:
# turn singal output on
mfli.sigouts[0].on(1)

# prepare a frequency sweep
mfli.sweeper.start(1e3)
mfli.sweeper.stop(10e3)
mfli.sweeper.samplecount(100)
mfli.sweeper.sweep_parameter("frequency")

# add a singal source
demod = mfli.sweeper.signals_add("demod0")
set sweep parameter to 'frequency': 'oscs/0/freq'
[17]:
mfli.sweeper.signals
[17]:
['/dev3337/demods/0/sample']
The measurement is simply started with the measure() method:
[18]:
# perform measurement
mfli.sweeper.measure()
subscribed to: /dev3337/demods/0/sample
Sweeping oscs/0/freq from 1000.0 to 10000.0
Progress: 0.0%
Progress: 4.0%
Progress: 10.0%
Progress: 15.0%
Progress: 20.0%
Progress: 25.0%
Progress: 30.0%
Progress: 35.0%
Progress: 40.0%
Progress: 45.0%
Progress: 50.0%
Progress: 55.0%
Progress: 60.0%
Progress: 65.0%
Progress: 70.0%
Progress: 76.0%
Progress: 81.0%
Progress: 86.0%
Progress: 90.0%
Progress: 95.0%
Finished
The results are stored in the results dictionary with the exact node path as the key. The value is a DAQResults object from the zhinst-toolkit. It contains all the data of the demodulator that has been returned by the Python API.
[19]:
result = mfli.sweeper.results[demod]
[20]:
result
[20]:
<zhinst.toolkit.control.drivers.base.sweeper.SweeperResult object at 0x000002409DEC8518>

attributes:
 - header
 - timestamp
 - samplecount
 - flags
 - sampleformat
 - sweepmode
 - bandwidthmode
 - auxin0
 - auxin0pwr
 - auxin0stddev
 - auxin1
 - auxin1pwr
 - auxin1stddev
 - bandwidth
 - frequency
 - frequencypwr
 - frequencystddev
 - grid
 - phase
 - phasepwr
 - phasestddev
 - r
 - rpwr
 - rstddev
 - settling
 - tc
 - tcmeas
 - x
 - xpwr
 - xstddev
 - y
 - ypwr
 - ystddev
 - count
 - nexttimestamp
 - settimestamp
[21]:
import matplotlib.pyplot as plt

plt.plot(result.frequency, result.x)
plt.show()
